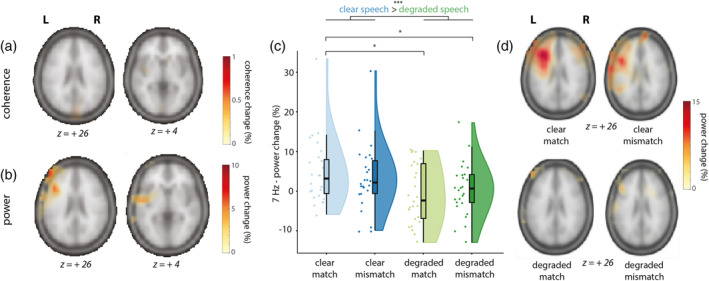
FIGURE 7.

Sources of the intermodulation frequency (fvisual‐fauditory) at 7 Hz and individual scores in the leftfrontotemporal ROI per condition (clear match/clear mismatch/degraded match/degraded mismatch). Z‐coordinates of slices are in mm and in MNI space. (a) Coherence change in percentage when comparing coherence values in the stimulus window to a poststimulus baseline for 7 Hz (intermodulation frequency, fvisual–fauditory), pooled over conditions. Only positive coherence values are plotted (>80% of maximum). No differences could be observed. (b) Power change in percentage when comparing power values in the stimulus window to a poststimulus baseline for 7 Hz, pooled over conditions. Power changes were largest in left‐frontal and left‐temporal regions. Highest peak value was at MNI coordinates −44, 24, 22, and extended from LIFG to pSTS/MTG. Only positive coherence values are plotted (> 80% of maximum). (c) Power change values in percentage extracted from the 7 Hz ROI in source space. Raincloud plots reveal raw data, density, and boxplots for power change per condition. (d) Power change in percentage when comparing power values in the stimulus window to a poststimulus baseline for 7 Hz, per condition
