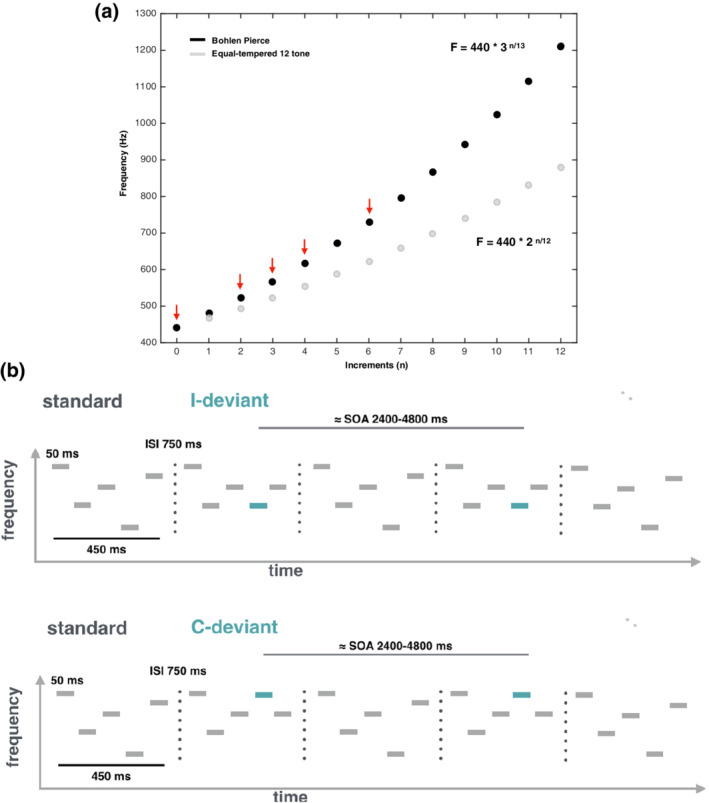
FIGURE 1.

Musical scale and auditory patterns used in the current study. (a) Illustration of pitch frequencies along the Western equal‐tempered 12‐tone scale (in gray) and the BP scale (in black). Red arrows point to the BP frequencies used to build melodic material (k = 440 Hz; n = 0, 2, 3, 4, or 6). (b) Schematic illustration of the melodic patterns presented to participants during the auditory oddball paradigm (adapted from Lumaca, Kleber, Brattico, Vuust, and Baggio (2019)). Participants were scanned while listening to these melodic patterns. Each pattern was 450‐ms long, and consisted of five 50‐ms sinusoidal tones separated by 50‐ms silent intervals. Melodic patterns were presented with 750‐ms of interstimulus interval (ISI) randomly at three frequency levels (lowest frequency: 440, 478, 567 Hz) belonging to the BP musical scale. Standard patterns (80%) followed the abstract rule EBCAD. In deviant patterns, the fourth tone was changed in frequency compared to its standard position, either producing a change in the melodic interval (I‐deviants; 10%) or in the pitch contour (C‐deviant; 10%). Pairs of deviant stimuli occurred in close temporal succession (jittering stimulus‐onset asynchrony [SOA] range, 2,400–4,800 ms) and were randomly interleaved with standard stimuli
