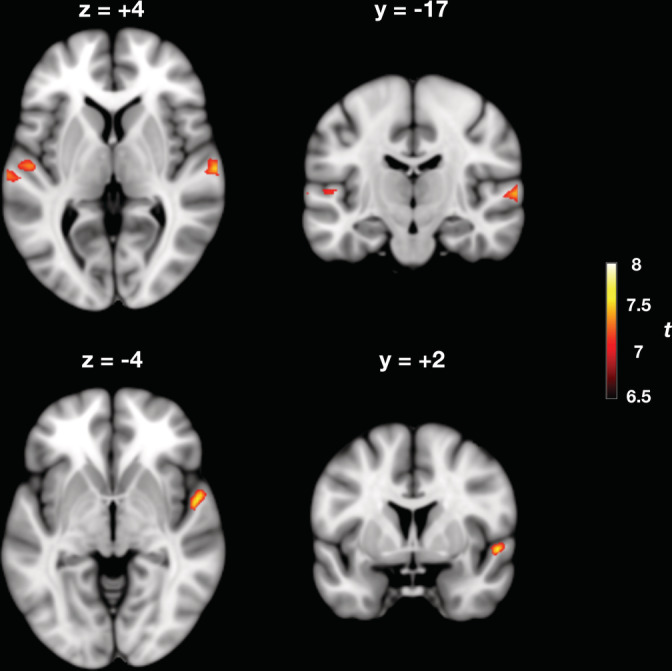
FIGURE 2.

Cortical areas responding to contour deviants in melodic patterns (C‐deviant > STD). Shown in the figure are the cortical loci where event‐related activity was greater for contour deviant events (C‐deviants) compared to the standard events occurring in the same position of the pattern (i.e., the fourth tone) (p < .001, familywise error [FWE] corrected). Activated areas are shown projected onto a Montreal Neurological Institute (MNI) standard template, and include bilateral Heschl's gyrus (HG) and planum temporale (PT). Color map intensities indicate t‐values
