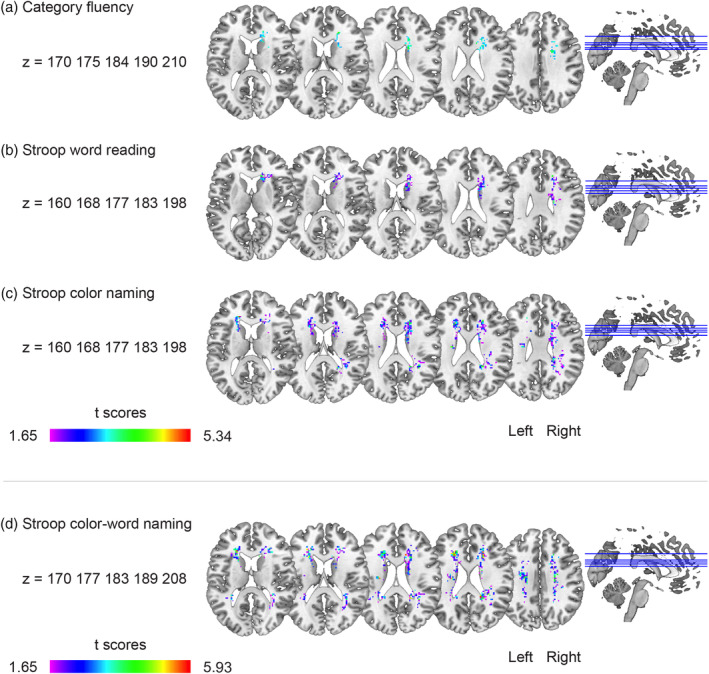
FIGURE 2.

Voxel‐based lesion–symptom mapping (VLSM) results. The statistically significant cluster of voxels associated with worse performance in each of the neuropsychological tests is shown. These maps show colorized depictions of t‐test results evaluating performance of the patients on a voxel‐by‐voxel basis. High t‐scores (red) indicate that lesions to these voxels have a stronger relationship with behavior. Dark purple voxels indicate regions where the presence of a lesion has a weaker relationship with the behavioral measure. The max t value is used for the color scale (see Table 3 for threshold t values). VLSM maps computed for (a) Category Fluency, (b) Stroop Color Word Test (SCWT) Word Reading, (c) SCWT Color Naming, and (d) SCWT Color‐Word Naming. Only voxels that were significant at p = .05 (controlling for the expected proportion of false positives) are shown. All results are corrected for age, sex, education, and lesion volume
