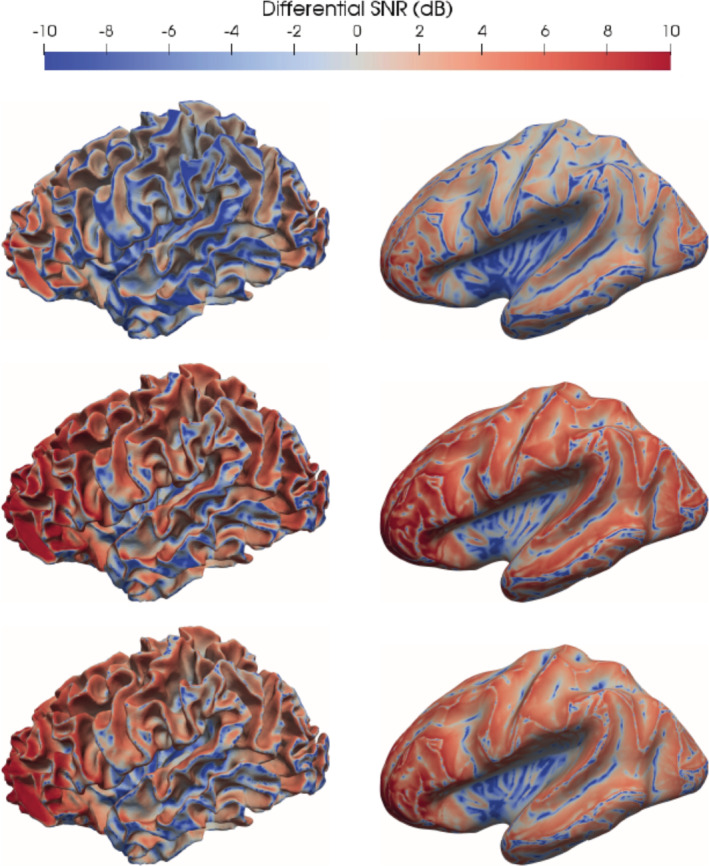
FIGURE 5.

Differential signal‐to‐noise ratio (SNR) when using head model 3CI (first row), 4CI (second row) and 6CA (third row) visualized on the cortical source space (left column) and on the inflated cortical source space (right column). The values are expressed in decibels. The areas depicted in red are the areas where the SNR of the magnetoencephalography (MEG) is larger than the SNR of the electroencephalography (EEG) and the areas depicted in blue are the areas where the SNR of the EEG is larger than the SNR of the MEG. The same scaling from −10 to +10 dB is used for all head models to enable an easier comparison
