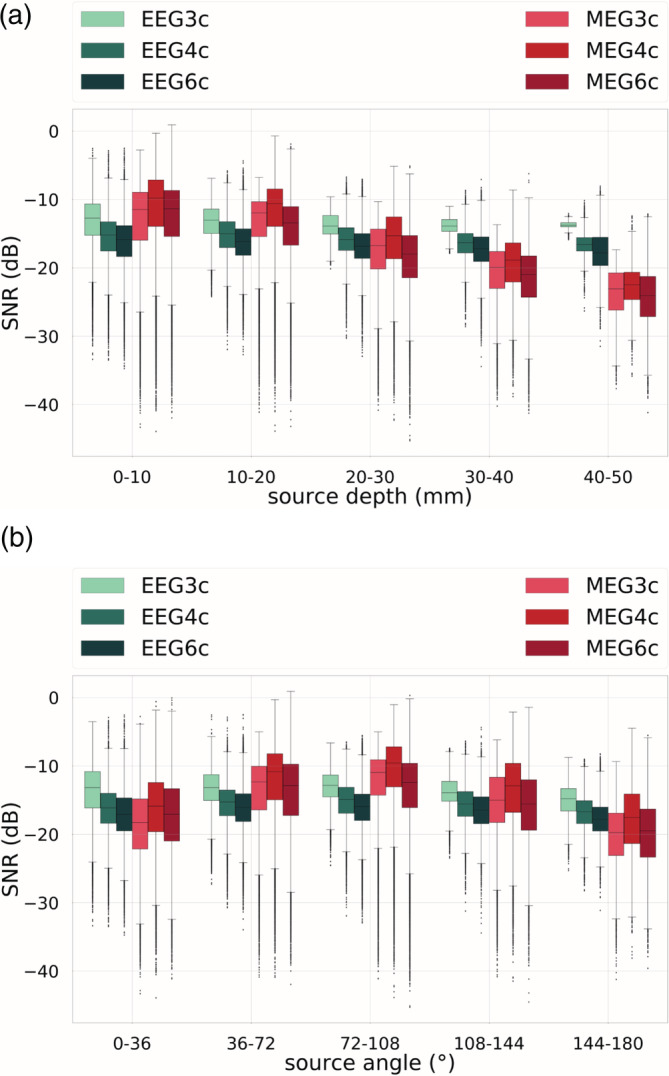
FIGURE 6.

Signal‐to‐noise ratio (SNR) values for cortical dipoles for electroencephalography (EEG) (in green shades) and magnetoencephalography (MEG) (in red shades) sorted by (a) source depth and (b) source angle for the three‐compartment isotropic (3CI), four‐compartment (+CSF) isotropic (4CI) and six‐compartment anisotropic (6CA) head models. In the boxplots, the analysis includes maximum and minimum, indicated by upper and lower error bars, and thereby the total range. Furthermore, it includes the interval between upper and lower quartile, that is, the interquartile range, which is marked by a box with a black dash showing the median
