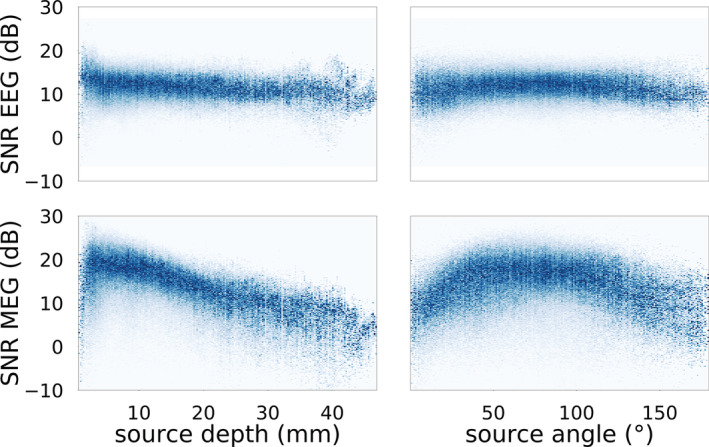
FIGURE 7.

Heatmaps normalized by column of electroencephalography (EEG) (upper row) and magnetoencephalography (MEG) (lower row) signal‐to‐noise ratio (SNR) values in dependency of source depth (left) and source angle (right) from the inner skull surface, when 6CA was adopted. Only cortical sources are taken into consideration here
