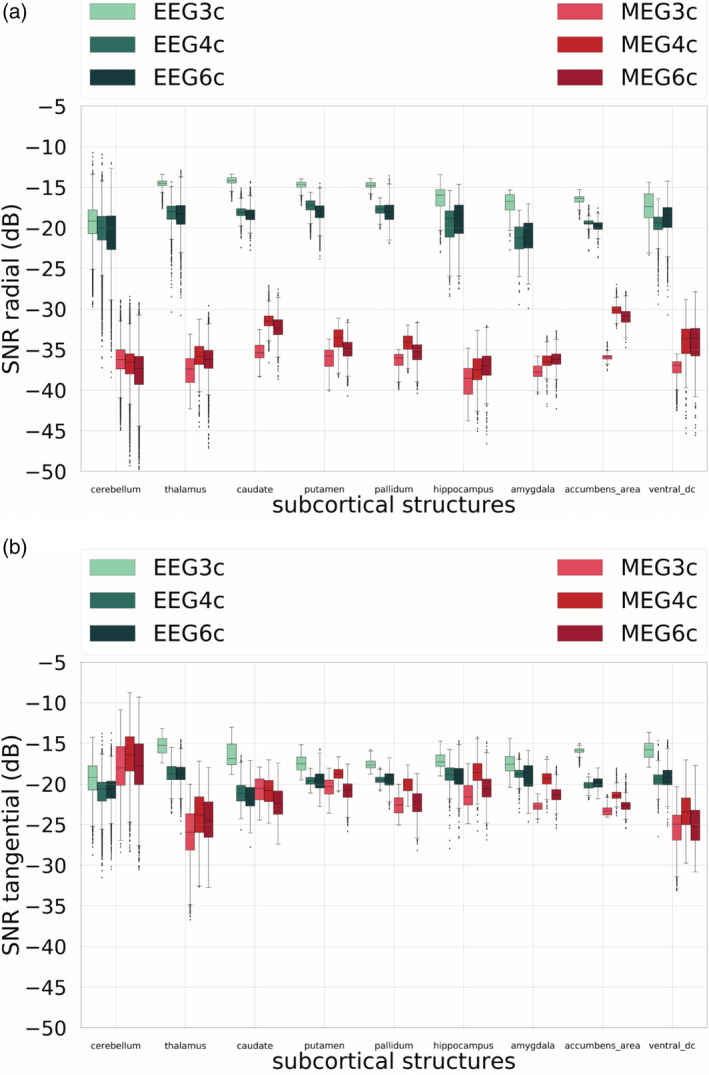
FIGURE 8.

Signal‐to‐noise ratio (SNR) values for radial (a) and the strongest tangential (b) components of electroencephalography (EEG) and magnetoencephalography (MEG) for subcortical dipoles. On the x‐axis, the nine subcortical areas considered are listed, on the y‐axis, the correspondent SNR values for head models 3CI, 4CI, and 6CA. Cold colors are used for the EEG SNR values, warm colors for the MEG SNR values. In the boxplots, the analysis includes maximum and minimum, indicated by upper and lower error bars, and thereby the total range. Furthermore, it includes the interval between upper and lower quartile, that is, the interquartile range, which is marked by a box with a black dash showing the median
