FIGURE 1.

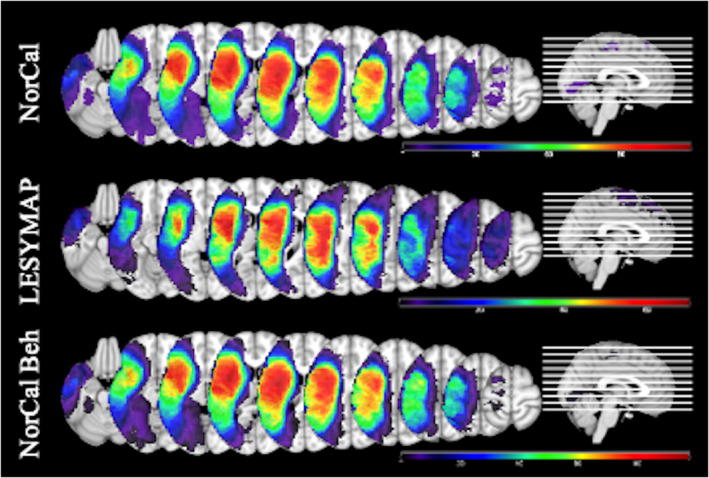
Lesion overlays for the three datasets. Top—NorCal (n = 209, coverage range 5–117). Middle—LESYMAP (n = 131, coverage range 5–68). Bottom—subset of NorCal used in the analysis of real behavioral data (n = 168, coverage range 5–96)

Lesion overlays for the three datasets. Top—NorCal (n = 209, coverage range 5–117). Middle—LESYMAP (n = 131, coverage range 5–68). Bottom—subset of NorCal used in the analysis of real behavioral data (n = 168, coverage range 5–96)