
FIGURE 10.
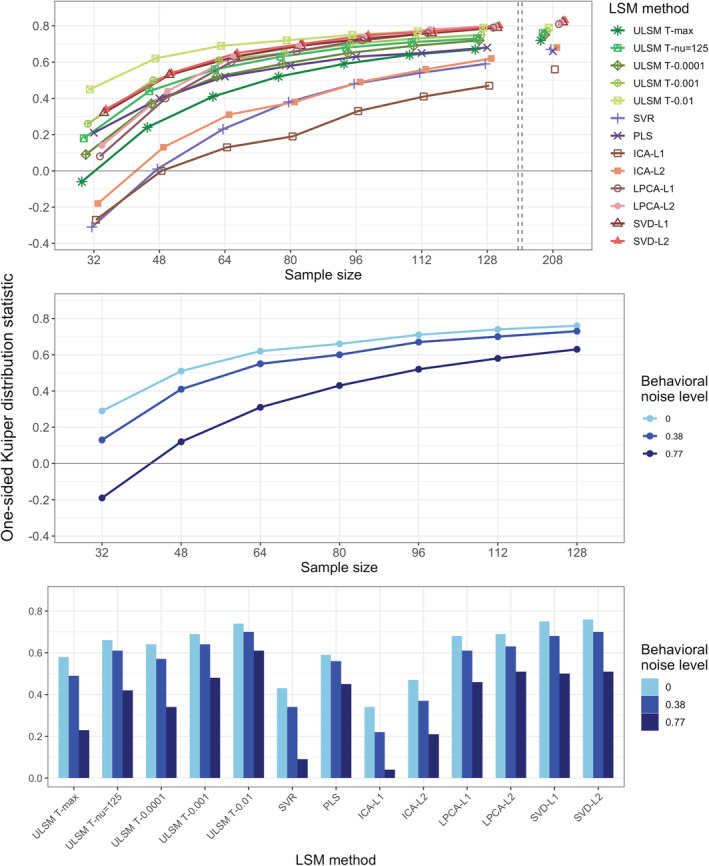
One‐sided Kuiper (OSK) distribution statistic as a function of the lesion symptom mapping (LSM) method and sample size (top panel), behavioral noise level and sample size (middle panel) or LSM method (bottom panel) for single target simulations