
FIGURE 11.
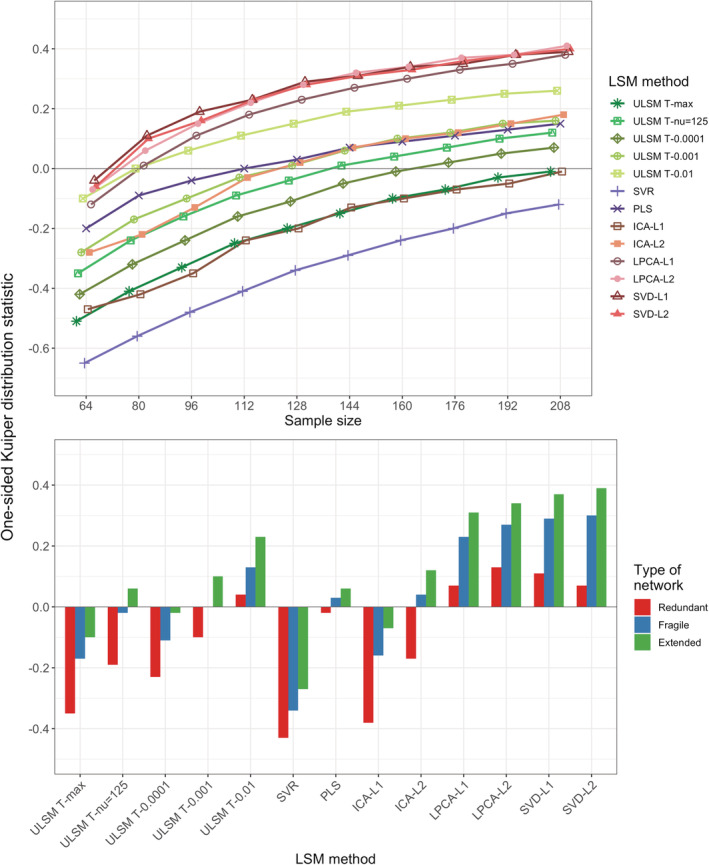
One‐sided Kuiper (OSK) weighted‐overlap statistic as a function of the lesion symptom mapping (LSM) method and sample size (top panel) or type of network (bottom panel) for dual‐target simulations
Official websites use .gov
A
.gov website belongs to an official
government organization in the United States.
Secure .gov websites use HTTPS
A lock (
) or https:// means you've safely
connected to the .gov website. Share sensitive
information only on official, secure websites.
One‐sided Kuiper (OSK) weighted‐overlap statistic as a function of the lesion symptom mapping (LSM) method and sample size (top panel) or type of network (bottom panel) for dual‐target simulations