
FIGURE 13.
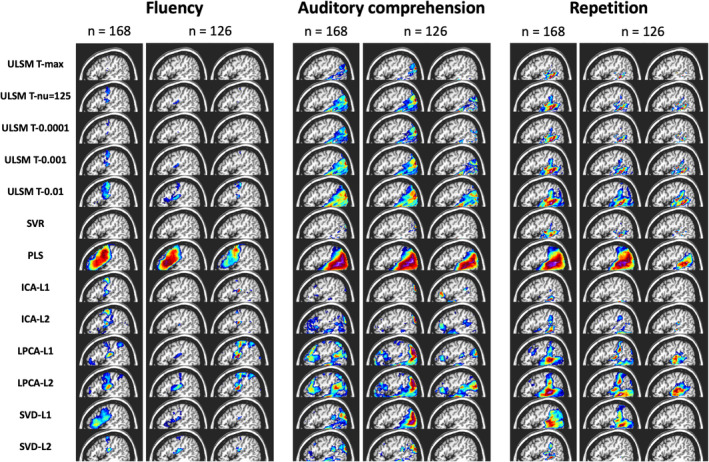
Results of lesion symptom mapping (LSM) analysis of real behavioral data across all LSM methods. For each LSM method, output maps are presented for the three language variables under examination (speech fluency, single‐word auditory comprehension, verbal repetition): for the full sample (n = 168) and two random subsamples (n = 126)