Figure 1.
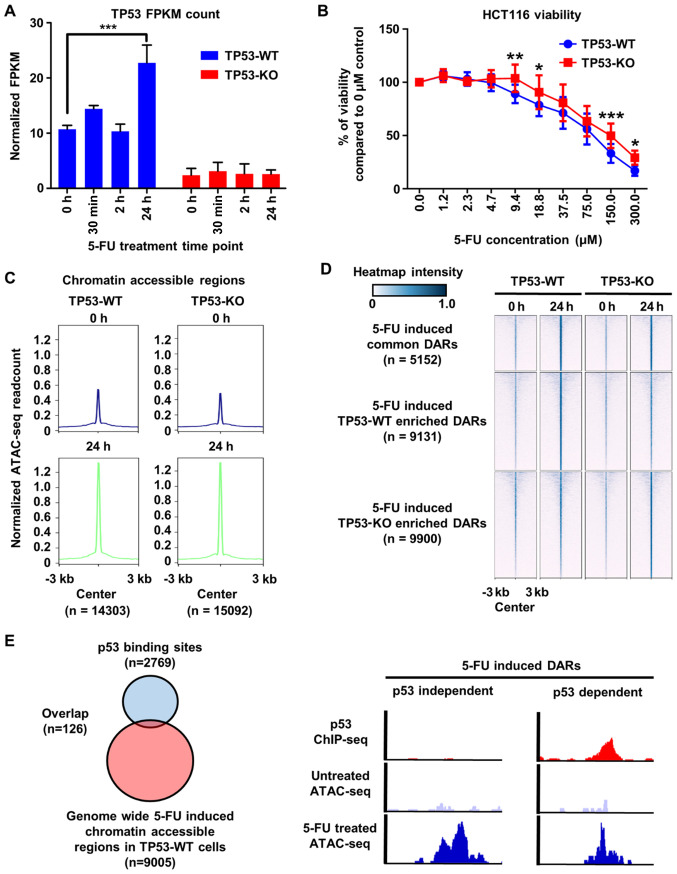
Distinct changes in chromatin accessibility in response to 5-FU depending on p53 status (A) TP53 mRNA expression levels were measured by RNA-seq for TP53-WT or -KO cells treated with 300 µM 5-FU for the indicated time points (n=2 per group). (B) The viability of TP53-WT and TP53-KO cells measured 72 h after treatment of various concentration of 5-FU (n=6 per group). (C) Histogram showing the average tag density of ATAC-seq peaks called for TP53-WT and TP53-KO cells before and after treatment with 5-FU for 24 h. (D) Heatmap showing differentially accessible chromatin regions in TP53-WT and TP53-KO cells before and after treatment with 5-FU for 24 h. (E) Venn diagram showing the overlap of TP53 ChIP-seq peaks and ATAC-seq peaks in TP53-WT cells treated with 5-FU for 24 h (left), and a genomic snapshot depicting representative DARs (right). The data are presented as a mean ± SD. *P<0.05; **P<0.01; ***P< 0.001. DARs, differentially accessible regions; TP53-WT, TP53-wild-type; TP53-KO, TP53-knockout.

