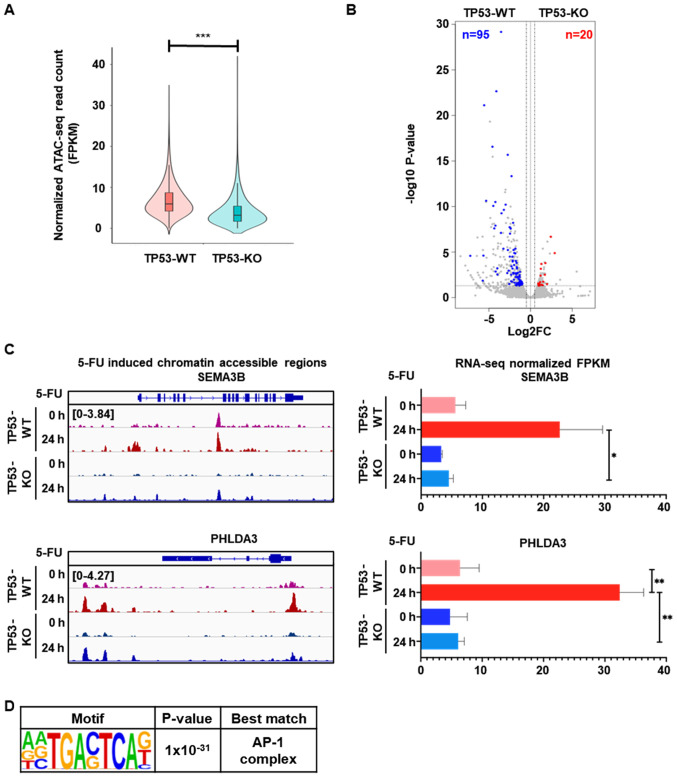
Figure 3.
Distinct 5-FU-induced gene expression is associated with higher chromatin accessibility in TP53-WT cells than TP53-KO cells. (A) Violin plot showing 9,131 DARs with higher 5-FU-induced chromatin accessibility in TP53-WT cells, compared to TP53-KO cells (n=2 per group, ***P<0.001). (B) Volcano plot showing DEGs associated with 5-FU-induced DARs that exhibited a greater than two-fold increase in TP53-WT cells, with an adjusted P-value of less than 0.05. The number of genes that exhibited greater than two-fold increases in TP53-WT (blue) and TP53-KO (red) cells with a P-value of less than 0.05 are indicated. (C) Genomic snapshot of the SEMA3B (upper left) and PHLDA3 (lower left) genes showing the densities of ATAC-seq reads in TP53-WT and TP53-KO cells before and after 5-FU treatment for 24 h. Bar graph shows the mRNA expression levels of SEMA3B (upper right) and PHLDA3 (lower right) genes measured by RNA-seq from TP53-WT and TP53-KO cells before and after 5-FU treatment for 24 h (n=2 per group, *P<0.05; **P<0.01). (D) Enriched de novo motif analysis for the DARs that showed both higher mRNA expression and greater chromatin accessibility in TP53-WT cells, compared to TP53-KO cells, after 5-FU treatment for 24 h. DARs, differentially accessible regions; TP53-WT, TP53-wild-type; TP53-KO, TP53-knockout.

