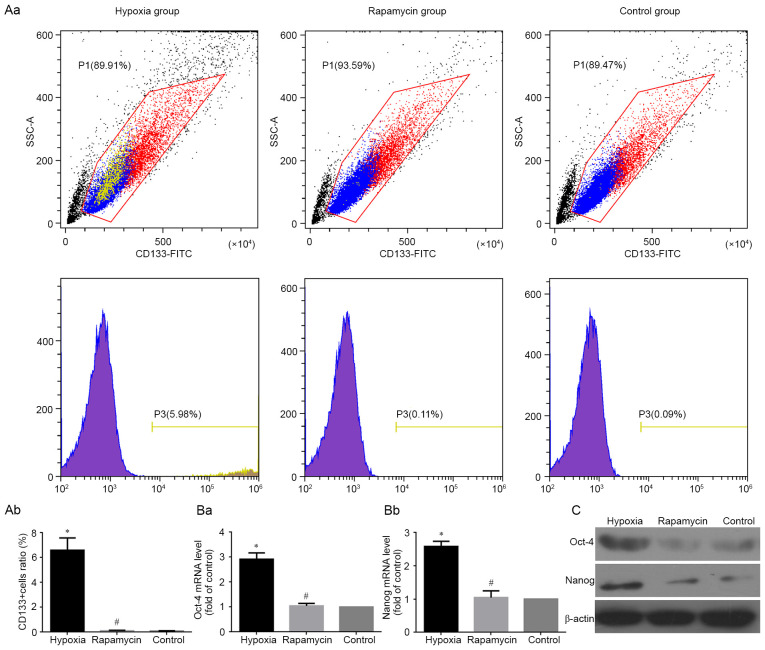
Figure 3.
Change of the expression of tumor stem cell markers. (A) CD133+ MNNG/HOS cells in different groups analyzed using flow cytometry analysis. (Aa) Representative images showing the expression ratio of CD133+ cells in different groups of MNNG/HOS cells. (Ab) Changes of the expression level of CD133+ cells in different groups of MNNG/HOS cells. (B) mRNA levels of (Ba) OCT4 and (Bb) Nanog in different groups analyzed using reverse transcription-quantitative PCR analysis. Data are normalized to GAPDH and represented as relative expression (relative to control). (C) Expression of OCT4, Nanog and CD133 protein in MNNG/HOS cells cultured in different groups analyzed using western blotting. β-actin was used as an internal control. *P<0.05 and #P>0.05 vs. control group.

