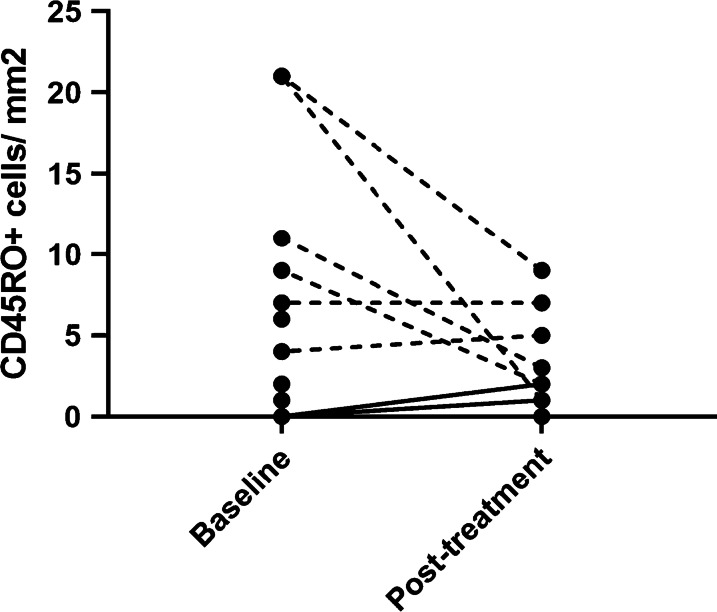
Fig. 2.
Plot of CD45RO-positive cells per mm2 of tumor area as quantified by immunohistochemistry. Matched baseline and post-treatment measurements are connected by a line. In total, 17 samples were obtained at baseline and of those, 11 had matched post-treatment biopsies. 3 patients had 0 positive cells both at baseline and post-treatment, and 2 patients had 0 positive cells at baseline and no paired post-treatment biopsy. The two patients with change from absent infiltrate at baseline to mild to moderate infiltrate on treatment are indicated by a solid line. *Note: A very high pre-treatment measurement (125 CD45RO+ cells/mm2 at baseline) is excluded from this figure; the patient had no corresponding post-treatment sample

