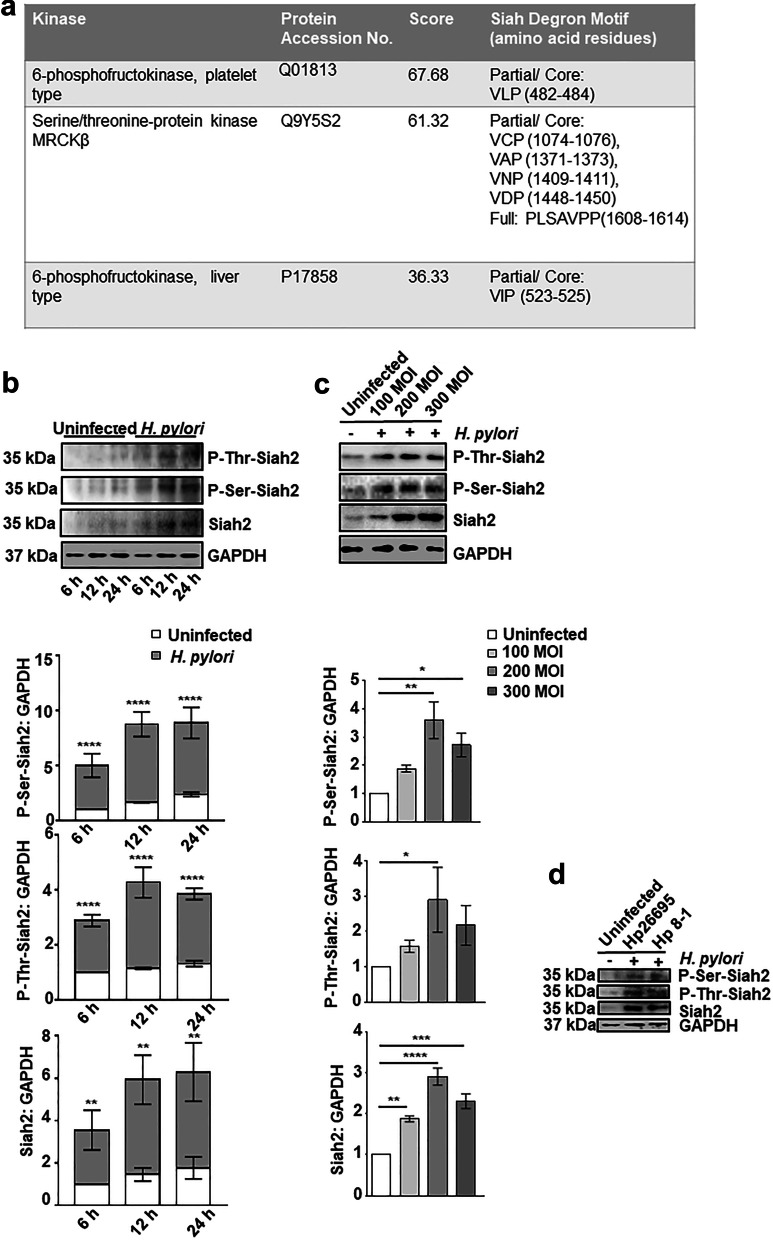
Fig. 1.
Siah2 phosphorylation is increased in H. pylori-infected GEC. a Table showing partial or full Siah degron motifs in the protein sequence of kinases identified by mass spectrometry. b Western blotting of total cell extracts prepared from the uninfected and H. pylori-infected (200 MOI) MKN45 cells at 6, 12, and 24 h post-infection show increased P-Ser-Siah2, P-Thr-Siah2 and Siah2 levels. Histograms clearly represent a significant increment of P-Ser-Siah2, P-Thr-Siah2 and Siah2 at all time points. Statistical significance is determined by two-way ANOVA followed by Tukey’s post hoc analysis. c Western blot of whole cell lysate from MKN45 cells uninfected and infected with H. pylori (MOI 100, 200 and 300 MOI for 12 h). Graphical representation reveals a significant increase of P-Ser-Siah2, P-Thr-Siah2 and Siah2 with 200 MOI of infection. One-way ANOVA is used to determine statistical significance. d A representative western blot from uninfected and infected (200 MOI for 12 h of H. pylori 26695 strain [cag PAI +] or 8–1 strain [cag PAI −]) MKN45 cells representing P-Ser-Siah2, P-Thr-Siah2 and Siah2. GAPDH is used as a loading control. All graphical data are mean ± sem (n = 3). *P < 0.05, **P < 0.01, ***P < 0.001, ****P < 0.0001

