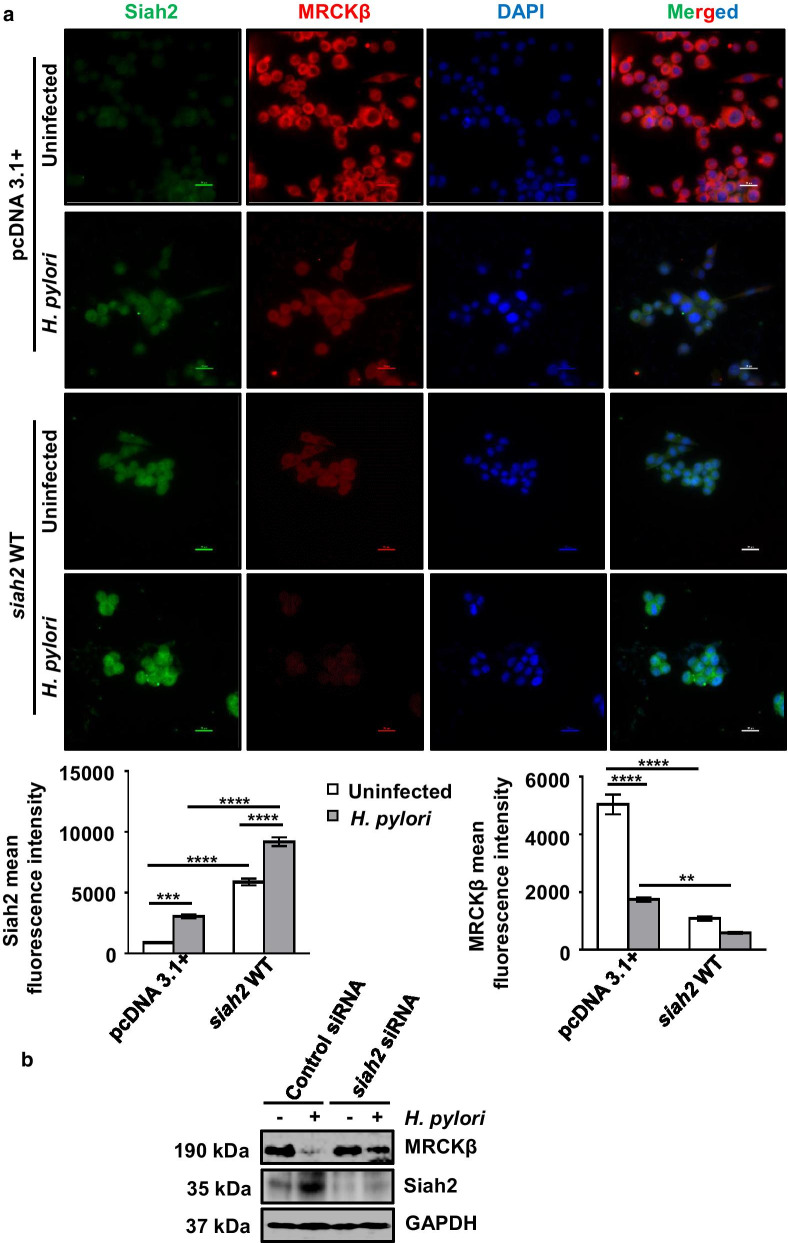
Fig. 3.
MRCKβ is degraded by Siah2. a Representative (n = 3) fluorescence microscopy of pcDNA3.1+ and siah2 WT stably-expressing MKN45 cells infected with H. pylori (200 MOI for 12 h). Images are captured using 60X objective and scale bars represent 20 μm. Bar graphs represent mean fluorescence intensity of Siah2 and MRCKβ obtained from cells of three independent experiments. Two-way ANOVA is used to determine statistical significance. All data are mean ± sem (n = 3). **P < 0.01, ***P < 0.001, ****P < 0.0001. b A representative western blot of control siRNA and siah2 siRNA-transfected MKN45 cells followed by 12 h H. pylori infection showing MRCKβ and Siah2 protein levels. GAPDH is used as a loading control

