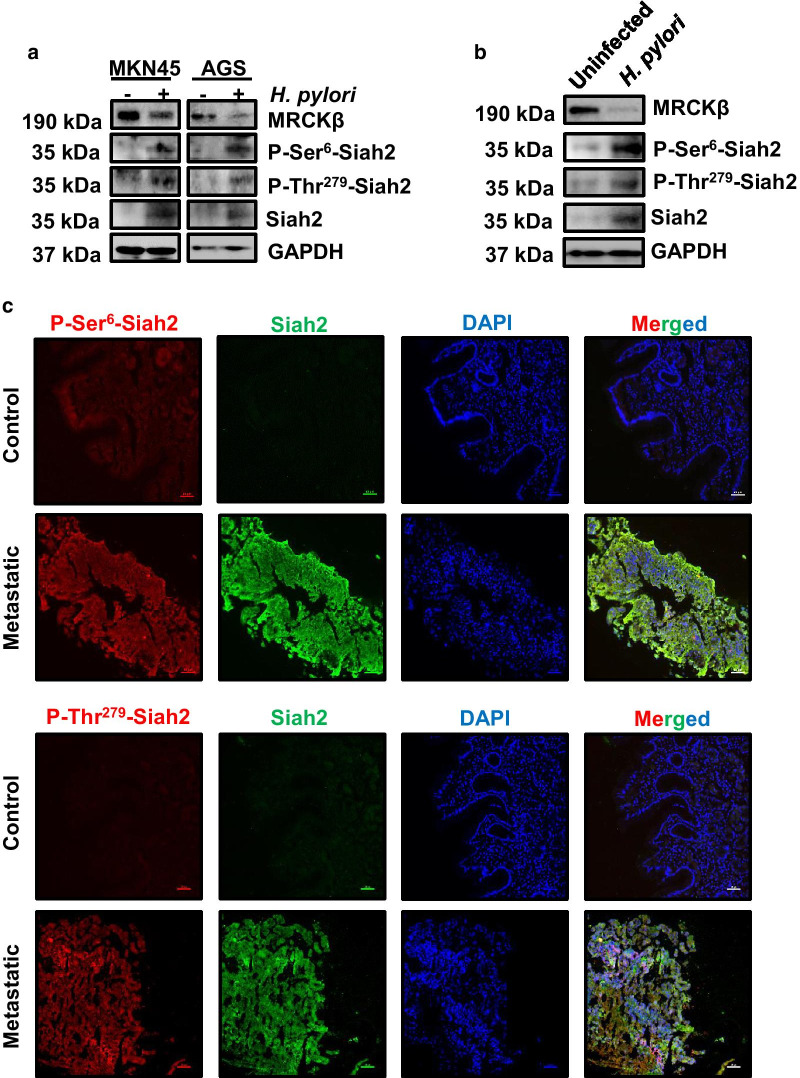
Fig. 5.
Increase in P-Ser/Thr-Siah2 in GECs and in human GC samples. a A representative western blot (n = 3) of uninfected and infected (200 MOI H. pylori, 12 h) MKN45 and AGS cells showing enhanced P-Ser6-Siah2, P-Thr279-Siah2 and Siah2 proteins. GAPDH is the loading control. b Representative western blot (n = 3) of uninfected and infected (200 MOI H. pylori, 12 h) HFE145 cells showing enhanced P-Ser6-Siah2, P-Thr279-Siah2 and Siah2 proteins. GAPDH is the loading control. c Immunofluorescence microscopy images of human gastric biopsy tissue (n = 9) showing the status of Siah2, P-Ser6-Siah2 (above) and P-Thr279-Siah2 (below) proteins. Tissues are sectioned at 5 μm thickness. Images are captured using 20× objective and scale bars represent 50 μm

