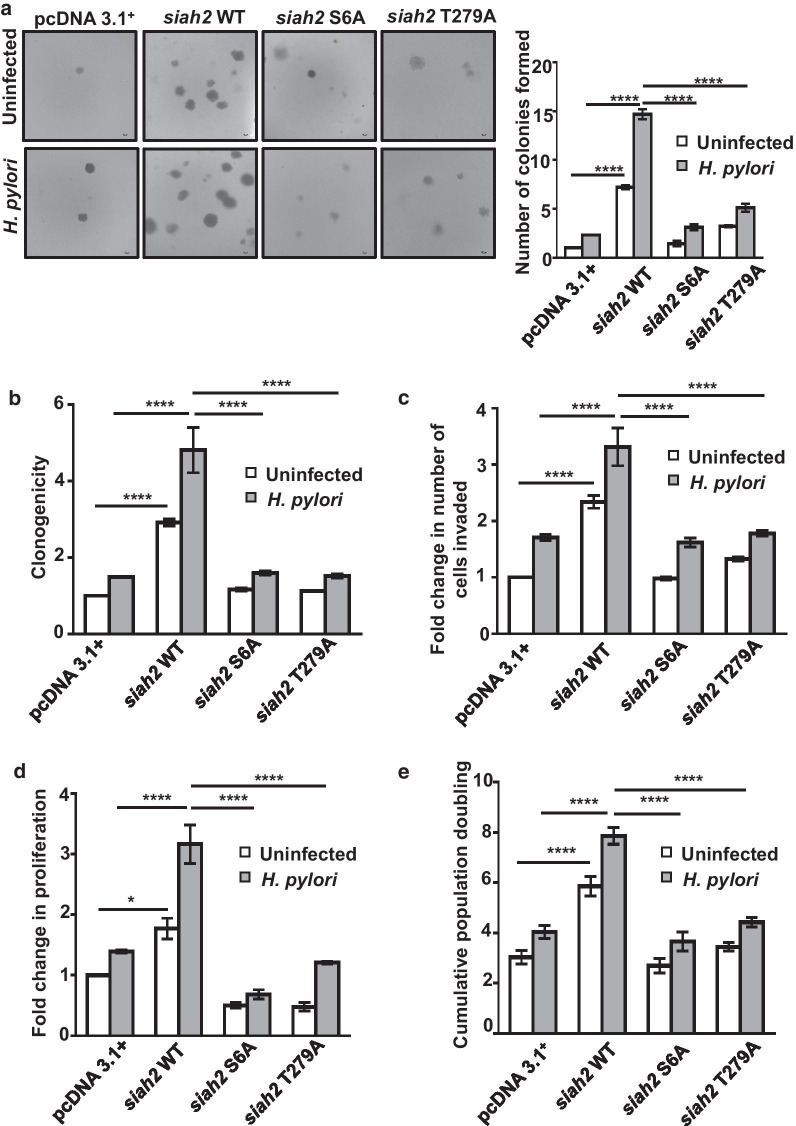
Fig. 7.
Phosphorylated Siah2 regulates GC progression. a Brightfield images showing colonies formed in soft agar assay (n = 3) by pcDNA3.1+, WT siah2, S6A and T279A siah2 mutant-expressing MKN45 stable cells. Images are taken using 4X objective and scale bar represents 100 μm. Colonies greater than 50 μm are counted. b Bar graph represents change in the colony formation ability of pcDNA3.1+, WT siah2 and Siah2 phospho-null mutant stably-expressing MKN45 cells. Results are normalized to the uninfected empty vector control. c Graphical representation of changes in the invasive potential of pcDNA3.1+, siah2 WT and Siah2 phospho-null mutant-expressing AGS stable cells as assessed by the number of invaded cells. Values are normalized to uninfected empty vector control. d Graphical representation of change in cellular proliferation assessed by MTT assay using pcDNA3.1+, siah2 WT and Siah2 phospho-null mutant-expressing MKN45 stable cells. e Graphical representation of cumulative population doubling of uninfected and H. pylori-infected pcDNA3.1+, siah2 WT and Siah2 phospho-null mutant-expressing MKN45 stable cells. In all of these panels two-way ANOVA following Tukey’s post hoc analysis calculates the statistical significance. All data represent mean ± sem (n = 3), *P < 0.05, ****P < 0.0001

