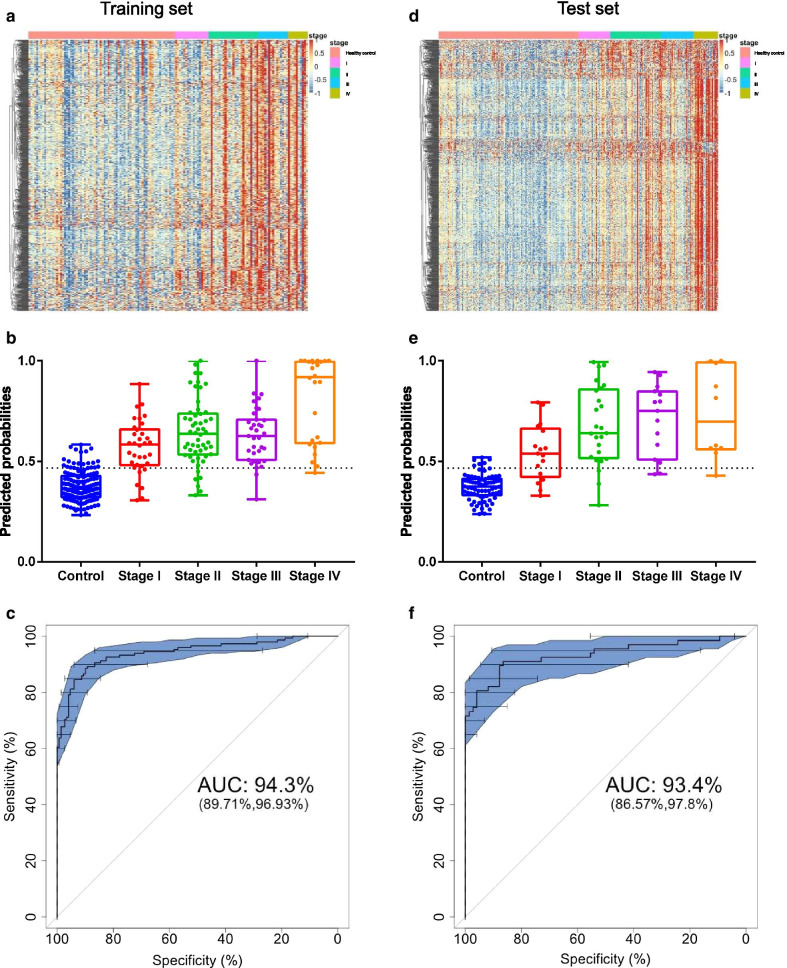
Fig. 2.
Predicted probabilities of the early detection model in training and test sets. a Heatmap depicted the clustering of methylation markers differentially methylated between participants with colorectal cancer and healthy controls in the training set. b Predicted probabilities for healthy controls and cancer patients with Stages I–IV in the training set. c ROC curve and corresponding AUC for the early detection model in the CRC diagnosis in the training set. c Heatmap depicted the clustering of methylation markers differentially methylated between participants with colorectal cancer and healthy controls in the test set. d Predicted probabilities for healthy controls and cancer patients with Stage I–IV in the test set. e ROC curve and corresponding AUC for the early detection model in the CRC diagnosis in the test set

