
Figure 2. Hepatocyte ATF3 regulates HDL uptake via SR-BI.
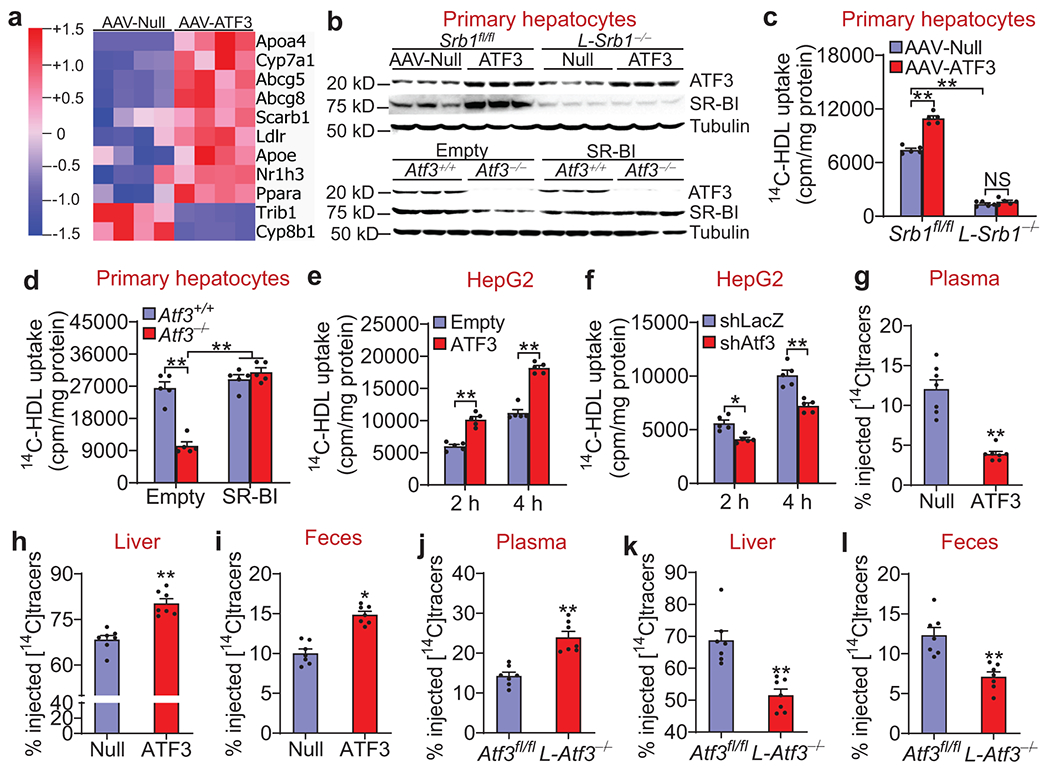
a. C57BL/6J mice were i.v. injected with AAV8-ALB-Null (AAV-Null) or AAV8-ALB-hATF3 (AAV-ATF3). After 2 months, total hepatic RNA was isolated for RNA sequencing (n=4). The heatmap shows that some lipid metabolism-related genes were up- or down-regulated by ATF3.
b-d. Scarb1fl/fl (Srb1fl/fl) or hepatocyte-specific Scarb1−/− (L-Srb1−/−) mice were i.v. injected with AAV8-ALB-Null or AAV8-ALB-hATF3 (b, top panel and c). In a separate study, Atf3+/+ or Atf3−/− mice were i.v. injected with 0.5x10⁹ pfu Ad-Empty or Ad-SR-BI (b, bottom panel and d). After 10 days, primary hepatocytes were isolated from these mice. Western blot assays were performed (n=3) (b). HDL uptake was carried out after hepatocytes were treated for 2 h with HDL labeled with [14C]cholesteryl Oleate (14C-HDL) (n=5) (c, d). In (c), **P<1E-6 for Srb1fl/fl+AAV-Null versus Srb1fl/fl+AAV-ATF3 or L-Srb1−/−+AAV-Null. In (d), **P=1E-6 for Atf3−/−+Ad-Empty versus Atf3+/++Ad-Empty, and **P<1E-6 for Atf3−/−+Ad-Empty versus Atf3+/++Ad-SR-BI or Atf3−/−+Ad-SR-BI.
e and f. HepG2 cells were infected for 36 h with Ad-Empty or Ad-ATF3 (e), or Ad-shLacZ or Ad-shAtf3 (f). HDL uptake was determined as described above (n=5). In (e), **P=0.000015 or <1E-6 for Ad-Empty versus Ad-ATF3 at 2 h or 4 h, respectively. In (f), *P=0.022 and **P=0.000054 for shellacs Ad-shLacZ versus Ad-shAtf3 at 2 h or 4h, respectively.
g-i. C57BL/6J mice were i.v. injected with AAV8-ALB-Null (Null) or AAV8-ALB-hATF3 (ATF3) (n=7). After 3 months, mice were i.v. injected with 14C-HDL. The radioactivity in the plasma (g), liver (h) and feces (i) were determined 24 h after injection with 14C-HDL. **P=0.0003, 0.00008 or 0.000017 versus Null for plasma (g), liver (h) or feces (i), respectively.
j-l. Atf3fl/fl mice and hepatocyte-specific Atf3−/− (L-Atf3−/−) mice were i.v. injected with 14C-HDL (n=7). After 24 h, the radioactivity in the plasma (j), liver (k) and feces (l) were determined. **P=0.0002, 0.0006 or 0.0010 versus Atf3fl/fl for plasma (j), liver (k) or feces (l), respectively.
All the data are expressed as mean±SEM. All the data points are biological replicates. A two-tailed Student’s t-test (g-l) or two-way ANOVA with Turkey’s post hoc test for multiple comparisons (c-f) was used for statistical analysis. NS, not significant. See also Extended Data Figs. 2–5 and Supplementary Data 1.