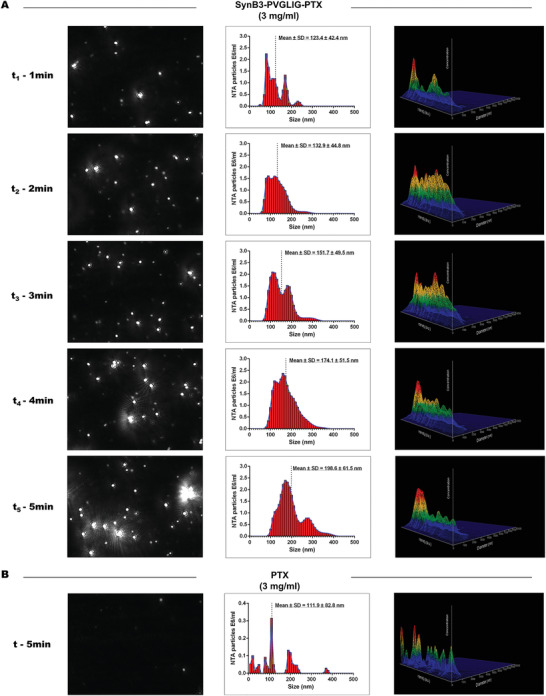
Figure 3.

Real‐time size distribution of SynB3‐PVGLIG‐PTX (3 mg mL−1) and PTX (3 mg mL−1) measured by NTA. The size distribution of particles measured by NTA (the middle panels) with the corresponding screenshot from the video captured by the system of NTA (the left panels), and 3D graph (diameter vs intensity vs concentration; the right panels) are presented. A) The solution of SynB3‐PVGLIG‐PTX (3 mg mL−1) was measured by NTA every minute after preparation. B) The solution of PTX at the concentration of 3 mg mL−1 was measured by NTA in 5 min after preparation.
