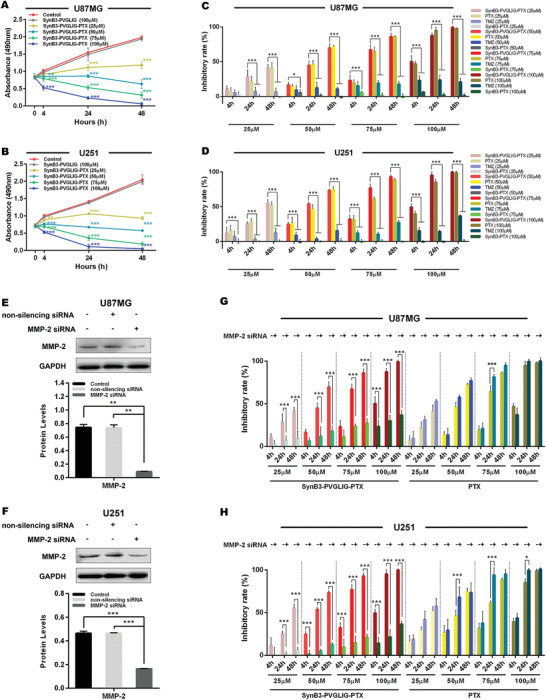
Figure 5.

The effect of SynB3‐PVGLIG‐PTX on cell proliferation in different GBM cells using the MTS assay. All data in this assay are represented as mean ± SD of three independently repeated experiments. A,B) The growth curves of U87MG and U251 cell lines treated with various concentration of SynB3‐PVGLIG‐PTX (25 × 10−6 to 100 × 10−6 м) for 4, 24, and 48 h, as indicated. SynB3‐PVGLIG‐PTX notably reduced proliferation of GBM cells (U87MG and U251) when compared with the control group (data presented as mean ± SD, n = 5, p‐values are calculated using two‐way ANOVA with Dunnett's post‐hoc test, **p < 0.01, ***p < 0.001). However, there was no significant difference between the dual‐functional peptide (SynB3‐PVGLIG) group and control group. C,D) The cellular proliferative inhibitory rates of SynB3‐PVGLIG‐PTX, PTX, TMZ, and SynB3‐PTX at different incubating concentrations (25 × 10−6, 50 × 10−6, 75 × 10−6, and 100 × 10−6 м) and time (4, 24, and 48 h) are presented as histograms. Data presented as mean ± SD, n = 5, p‐values are calculated using two‐way ANOVA with Tukey's post‐hoc, *p < 0.05, ***p < 0.001. E,F) MMP‐2 expression was efficiently down‐regulated by transfecting MMP‐2 siRNA in U87MG and U251, as determined by western blots. GAPDH was classified as the loading control. Data presented as mean ± SD, n = 5, p‐values are calculated using one‐way ANOVA with Tukey's post‐hoc, **p < 0.01; ***p < 0.001. G,H) The inhibitory effects of SynB3‐PVGLIG‐PTX and PTX on the proliferation of U87MG, MMP‐2 siRNA‐transfected U87MG, U251, and MMP‐2 siRNA‐transfected U251 were shown in accordance with different treated times (4, 24, and 48 h) and concentrations (25 × 10−6, 50 × 10−6, 75 × 10−6, and 100 × 10−6 м). Data presented as mean ± SD, n = 5, p‐values are calculated using two‐way ANOVA with Tukey's post‐hoc, *p < 0.05, ***p < 0.001.
