
Figure 6.
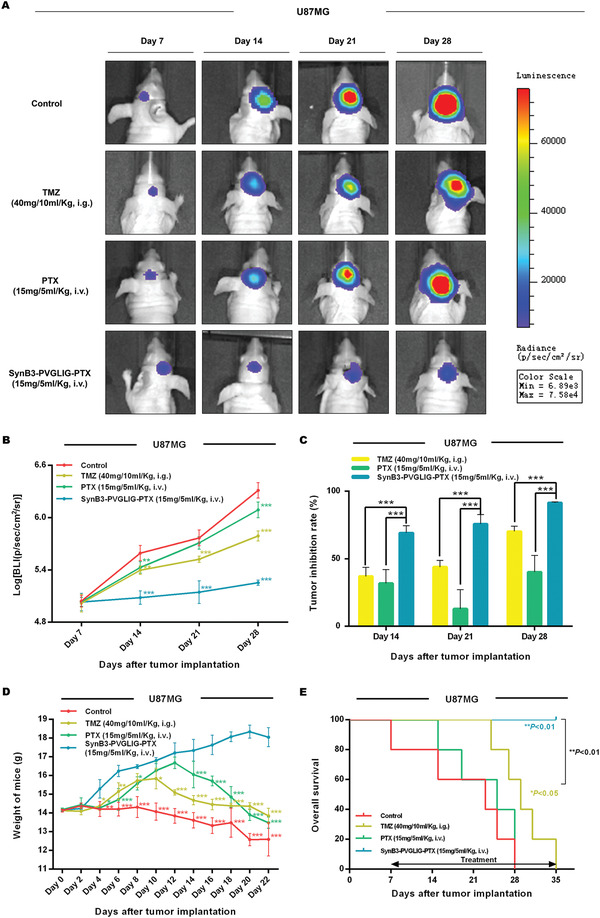
Effect of SynB3‐PVGLIG‐PTX on tumor growth, body weight, and overall survival of U87MG bearing nude mice. A) In vivo bioluminescence images of the intracranial glioma xenograft nude mice generated with the indicated U87MG cells after administration of TMZ (40 mg/10 mL kg−1, i.g., five times a week), PTX (15 mg/5 mL kg−1, i.v., twice a week), or SynB3‐PVGLIG‐PTX (15 mg/5 mL kg−1, i.v., twice a week). Representative images of mice are shown. B) Fluorescence intensity was recorded as p s−1 cm−2 sr−1. The bioluminescence quantification results at days 7, 14, 21, and 28 after implantation (n = 5 for each group) are shown. Compared with the control group, data are expressed as mean ± SD. **p < 0.01; ***p < 0.001 by two‐way ANOVA with Tukey's post‐hoc. C) All data are expressed as mean ± SD, n = 5. Compared with the SynB3‐PVGLIG‐PTX group, ***p < 0.001 by two‐way ANOVA with Tukey's post‐hoc. D) The weights of mice were measured every other day, which are expressed as mean ± SD, n = 5. Compared with the SynB3‐PVGLIG‐PTX group, *p < 0.05, **p < 0.01, ***p < 0.001 by two‐way ANOVA with Dunnett's post‐hoc. E) Kaplan–Meier analysis of the overall survival of glioma‐bearing nude mice. *p < 0.05 for the difference between the control group and the TMZ group, **p < 0.01 for TMZ group versus SynB3‐PVGLIG‐PTX group, **p < 0.01 for control group versus SynB3‐PVGLIG‐PTX group.