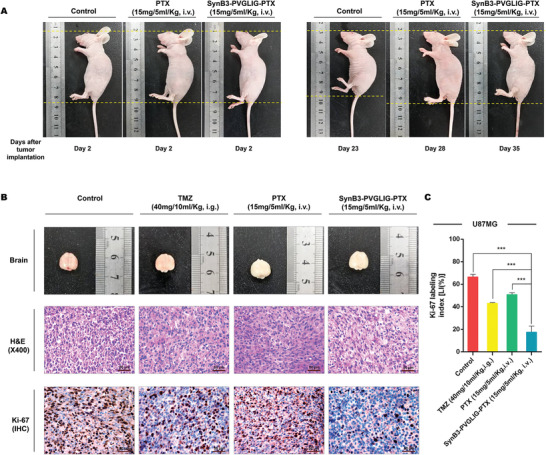
Figure 7.

Proliferative indices of U87MG xenograft tumors after administration. A) Representative images of nude mice at day 2 and the day of death after tumor implantation in the control group, PTX group, and SynB3‐PVGLIG‐PTX group. From these images, it was found that the height of mice treated with PBS as the control was significantly decreased, while there was no substantial change in PTX group and SynB3‐PVGLIG‐PTX group. This result is consistent with body weight results, further indicating that PTX and SynB3‐PVGLIG‐PTX could facilitate survival in mice. B) Macroscopic appearance, H&E staining images of tumors, and IHC of Ki‐67 in outgrowing tumor slices. Scale bars for H&E and IHC: 50 µm (× 400). All images of representative tumors are presented. C) Comparisons of LIs (%) of Ki‐67 in the xenograft tumor tissue from different groups. All experiments were performed at least in triplicate and the data are denoted as mean ± SD, n = 5. ***p < 0.001 compared with the SynB3‐PVGLIG‐PTX group by one‐way ANOVA with Tukey's post‐hoc.
