
Figure 9.
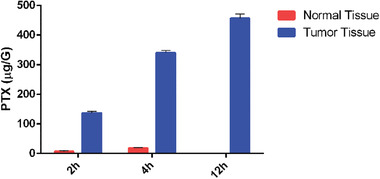
The concentration‐time profiles of PTX in different brain tissues. This experiment was performed following a single dose administration of SynB3‐PVGLIG‐PTX (5.25 µmol/5 mL kg−1, i.v.) in U87MG xenograft nude mice. Data presented as mean ± SD, n = 5.