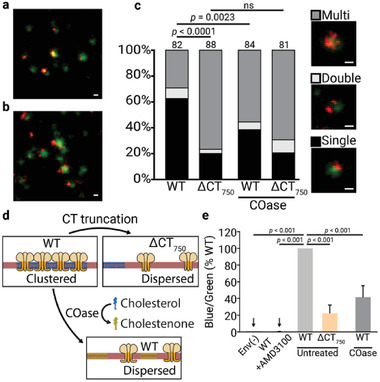
Figure 5.

Env distribution patterns of virus particles with full‐length or the truncated ΔCT750 gp41 and its effect on entry. a,b) Representative images of Vpr.eGFP (green) and Env (orange) signal of virus particles with full‐length and the truncated ΔCT750 gp41, respectively. c) Env distribution patterns of virus particles with full‐length and the truncated ΔCT750 gp41, with and without Cholesterol oxidase (COase) treatments. The number of viral particles quantified in each preparation is represented above the bars (n > 80). The statistical significance was assessed by χ 2 test for independence at two degrees of freedom. Images show examples of virus particles for each Env distribution class. Scale bars: 100 nm. d) Schematic representation of Env cluster dispersion caused by gp41 ΔCT750 truncation, and by conversion of chol to cholestenone by COase. Viral membrane in red, Env trimers in orange, chol molecules in blue, and cholestenone molecules in green. e) Effect of ΔCT750 truncation and COase treatment in entry capacity of concentrated BlaM.Vpr mature viral particles. For each variant, a viral amount corresponding to 30 ng of CA was incubated with Jurkat E6‐1 cells. As a control, viral particles lacking Env (Env(−)), and WT viral particles treated with the entry inhibitor AMD3100 (WT+AMD3100) were used. COase‐treated viral particles were incubated with 0.5 U of COase for 30 min at 37 °C. Untreated viral particles were incubated for 30 min at 37 °C without enzyme. The relative fluorescent intensity ratios of the cleaved (blue) and uncleaved (green) Vpr.BlaM fluorescent substrate CCF2 loaded into the cells was measured for each variant. The bars and whiskers represent the mean ± SD of experiments from five independent viral purifications (n = 5) with four replicas each. Statistical significance was assessed by analysis of variance and Tukey test.
