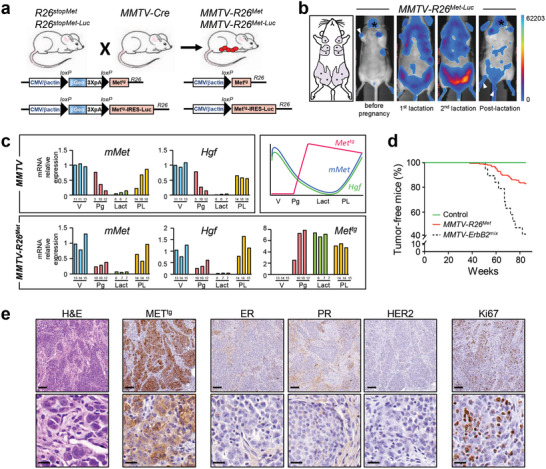
Figure 1.

Increased expression of wild‐type MET levels in the mouse mammary gland leads to TNBC formation. a) Strategy used to enhance wild‐type MET in the mammary gland of mice. The R26stopMet mouse line, carrying the LacZ‐stop cassette followed by chimeric Mettg, was crossed with the MMTV‐Cre mice, carrying the Cre recombinase under the control of the mouse mammary tumor virus MMTV promoter. After recombination, expression of the Mettg is ensured by the removal of the LacZ‐stop cassette (MMTV‐R26Met mice). The same strategy was used to generate transgenic mice carrying the LacZ‐stop cassette followed by Mettg and IRES‐Luciferase before (R26stopMet‐Luc) and after (MMTV‐R26Met‐Luc) Cre‐mediated recombination. b) Non‐invasive in vivo bioluminescence imaging of MMTV‐R26Met‐Luc mice. Imaged mice were either not pregnant, under lactation (first or second lactation cycle), or in postlactation phase (n = 6 mice per group). Although mainly detected in the mammary glands, low luciferase expression was also observed in the salivary gland (asterisk), in the skin of the paws and tail (white arrowhead), which is due to partial leakage of the MMTV‐Cre line, as previously reported.[ 34 ] The five pairs of the mouse mammary glands are depicted on the scheme in the left. c) RT‐qPCR analyses showing transcript levels of the endogenous mouse Met (mMet), Hgf, and the Mettg, in mammary glands of either MMTV (upper left panel) or MMTV‐R26Met (lower panel) mice. Mammary fat pads of three different mice were used for each stage. The age of each mouse is indicated (for virgin animals (V): in weeks; for the other stages: pregnancy (Pg), lactation (Lact), and postlactation (PL): in days). The scheme on the top right illustrates the dynamic expression of the various transcripts. Note that during lactation, the expression levels of the endogenous Met and Hgf transcripts are very low, whereas expression of the Mettg is maintained. d) Kaplan–Meier analysis of mammary gland tumor incidence in MMTV‐R26Met (n = 32), control (R26STOPMet, n = 17), and MMTV‐ErbB2 mice (n = 19) generated in the same mixed (C57/129, 50%/50%) genetic background (MMTV‐ErbB2mix). e) Representative histopathological and immunohistological analysis of MMTV‐R26Met tumors (n = 24) using hematoxylin/eosin (H&E), anti‐human MET staining to detect expression of the MET transgene (METtg), anti‐Ki67 to assess the proliferative index. Expressions of the estrogen‐ (ER), progesterone‐(PR), and ErbB2 receptors (HER2) were also analyzed. Scale bar: top panel: 100 µm, bottom panel: 20 µm.
