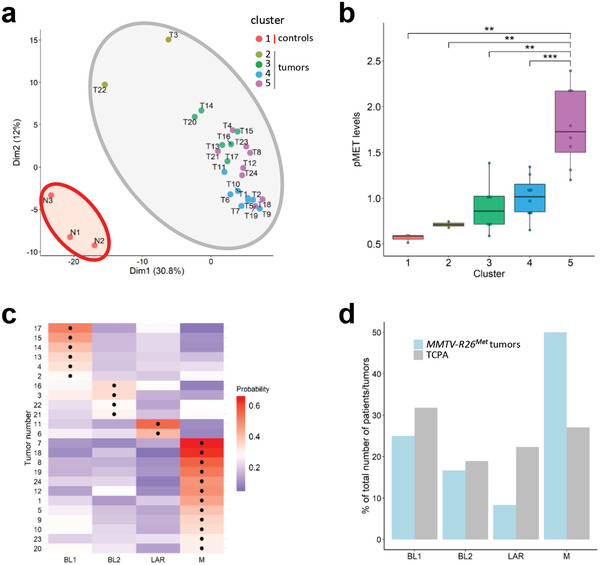
Figure 2.

Machine learning processing of RPPA data from tumors (n = 24) and control (n = 3) illustrates that the MMTV‐R26Met model faithfully recapitulates intertumoral heterogeneity of human TNBC. a) K‐means clustering (using k = 5 clusters) of the RPPA data for control mammary gland (from either MMTV (N1 and N2) or MMTV‐R26Met (N3) mice) and tumor samples is depicted in the PCA plot. The red area includes the normal mammary tissue (cluster 1; n = 3), whereas the grey area includes the tumors separated into four clusters defined by the points color (cluster 2–5). b) Clusters defined in (a) are characterized by different MET phosphorylation status. Colors of the clusters in panels (a) and (b) are the same. c) Heatmap depicting the probability that each tumor belongs to a specific subtype. The black dots indicate the type with the highest probability for each tumor. BL1: basal‐like‐1; BL2: basal‐like‐2; LAR: luminal androgen receptor; M: mesenchymal. d) Histogram reporting enrichment of the tumors compared to The Cancer Proteome Atlas (TCPA). Note that, even though all subtypes are represented, MMTV‐R26Met tumors are more enriched for the mesenchymal (M) subtype. Values are expressed as means ± s.e.m. ** P < 0.01; *** P < 0.001.
