Figure 3.

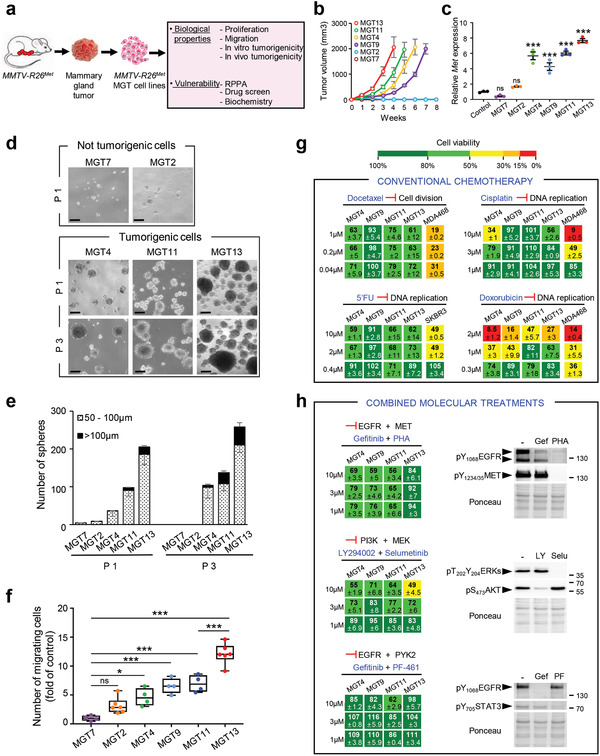
Cells derived from MMTV‐R26Met mammary gland tumors recapitulate primary resistance to drugs used in conventional chemotherapies and to combined molecular treatments. a) MMTV‐R26Met mammary gland tumors (MGT) were used to generate MMTV‐R26Met MGT cell lines, which were then utilized for assessing various biological properties and vulnerability to drugs. b) In vivo tumorigenic properties of the MMTV‐R26Met cell lines. Xenografts studies were performed by subcutaneous injection of cells in the flank of nude mice (n = 4–5, injected bilaterally). Evolution of the tumor volume shows that MGT4, MGT9, MGT11, and MGT13 are highly tumorigenic cell lines, whereas the MGT2 and MGT7 cells do not form tumors. c) Graph reporting total Met mRNA levels (endogenous plus exogenous) in the 6 MMTV‐R26Met MGT cell lines compared to normal mammary epithelial cells (control). Three independent biological samples were used per line. d,e) Tumor sphere formation assessing in vitro tumorigenicity of MMTV‐R26Met cells. (d) Representative images of tumor spheres derived from MGT7, MGT2, MGT4, MGT11, and MGT13 cells, obtained after 1 (P1) or 3 (P3) passages. (e) Histogram reporting the number of spheres, classified in two groups according to their size (dotted bars: 50–100 µm; black bars >100 µm), generated by the indicated MMTV‐R26Met cell lines. Note that i) the very low capacity of MGT2 and MGT7 in forming spheres is totally abolished after 3 passages, and ii) the number and size of spheres generated by MGT4, MGT11, and MGT13 increases from passage 1 to passage 3, reflecting their self‐renewal capacity. Each experiment was done in triplicate. Three independent experiments were performed. f) Quantification of the migration capacity of each MMTV‐R26Met cell line determined by the number of migrating cells compared to MGT7 (fold of control). Three independent experiments were performed. g) Cell viability of MMTV‐R26Met MGT cells exposed to drugs conventionally used in chemotherapy. Human TNBC cell lines (MDA‐MB‐468 and SKBR3) were used as positive controls. Percentage of cell viability in presence of drugs compared to controls (untreated cells) is indicated. Percentages are reported using a color code (from green to red; the scale is shown on the top and is used as a reference in all studies). h) Dose–response effects of drug used in combined treatments on the viability of MMTV‐R26Met MGT cells. Western blots depict the effect of each drug on its specific target. Note loss of EGFR phosphorylation in cells treated with PHA‐665752, the MET inhibitor. 5′FU: 5‐fluorouracil; Gef: gefitinib; LY: LY294002; PF: PF‐461; PHA: PHA‐665752; Selu: selumetinib. Values are expressed as means ± s.e.m. For multiple comparisons (for (c), (e), and (f)), statistical significance was assessed by one‐way ANOVA followed by Tukey test. Not significant (ns) P > 0.05; * P < 0.05; *** P < 0.001. Statistical analyses are reported in (e) Table S9 of the Supporting Information, and (f) Table S10 of the Supporting Information.
