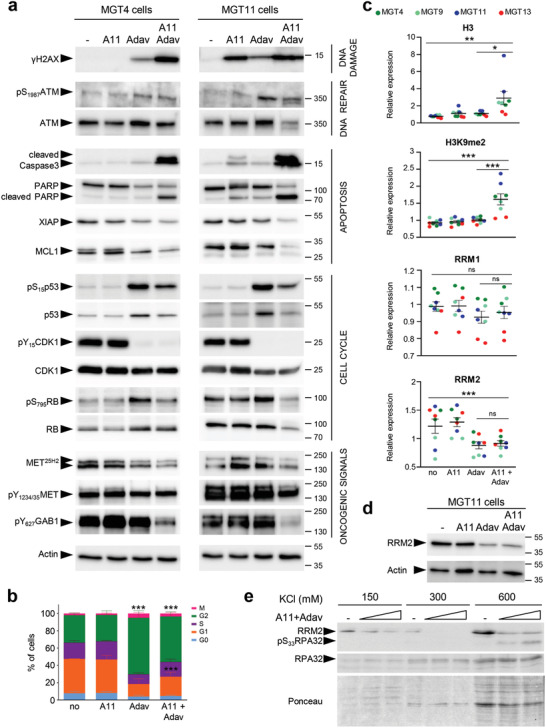
Figure 7.

BCL‐XL targeting exacerbates WEE1 requirement in TNBC cells. a) Western blots showing the effects of A1155463 (1 × 10⁻⁶ m), Adavosertib (3 × 10⁻⁶ m), and combined treatment on the indicated signals in the MGT4 and MGT11 cells, 12 h after treatment. For MGT4, p53 panel corresponds to a short exposure time in which basal levels are barely visible (compared to those reported in Figure S3e, Supporting Information), to document its upregulation upon drug treatment. At least two independent experiments were performed. b) Graph reporting the distribution of cells treated with the indicated drugs (for 12 h), compared to untreated cells (no), in each phase of the cell cycle as determined by flow cytometry using PI and Ki67 staining. Three independent experiments were performed. Statistical analyses were performed by two‐way ANOVA followed by Tukey test, and are reported in Table S11 of the Supporting Information. c) Graphs reporting changes by RPPA in levels of Histone H3, H3K9me2, RRM1, and RRM2 in MGT cells exposed to A1155463, Adavosertib, or in combination. Distinct MGT cell lines are indicated in colors. For multiple comparisons, statistical significance was assessed by one‐way ANOVA followed by Tukey test. d) Western blot showing RRM2 downregulation in MGT11 cells treated with Adavosertib alone or in combination with A1155463. Representative results of two independent experiments. e) Western blot showing downregulation of RRM2 and increase of pS33RPA32 levels in the chromatin fraction (corresponding to the 600 × 10−3 m KCl) of cells cotreated with WEE1+BCL‐XL (A11+Adav). Cells were treated with A1155463 (0.3 × 10⁻⁶ m) plus Adavosertib (1 or 3 × 10⁻⁶ m). Two independent experiments were performed. A11: A1155463; Adav: Adavosertib. Values are expressed as the mean ± s.e.m. not significant (ns) P > 0.05; * P < 0.05; ** P < 0.01; *** P < 0.001.
