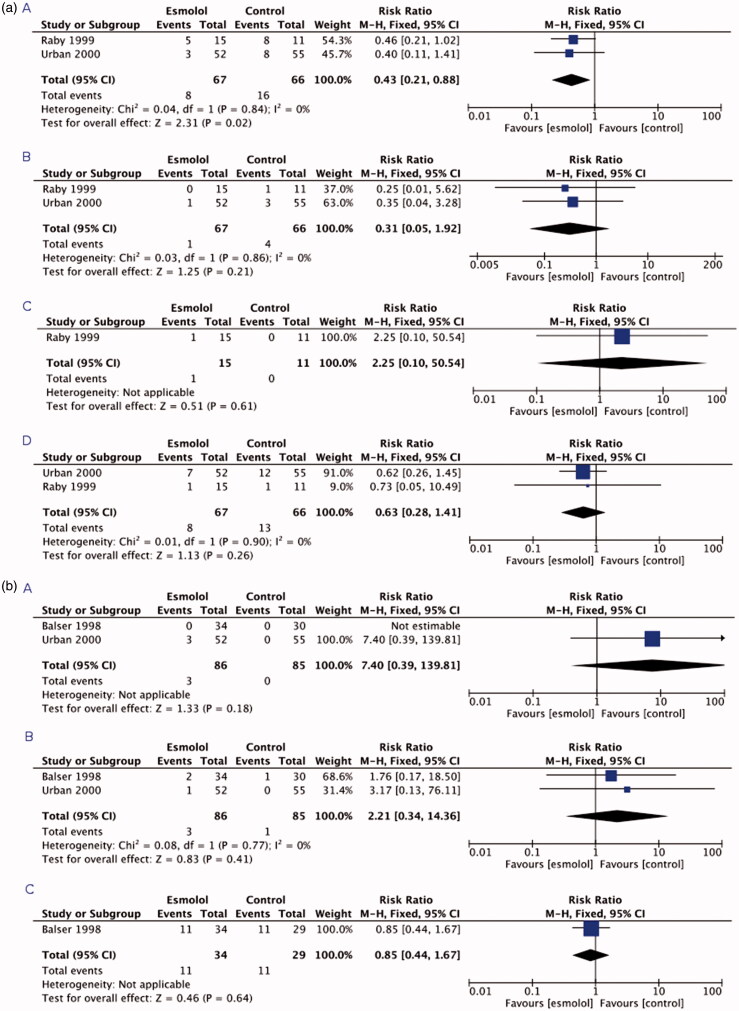
Figure 2.
(A) Forest plots of the comparisons (panel A) myocardial ischaemia, (panel B) myocardial infarction, (panel C) unstable angina pectoris, and (panel D) a composite of cardiac events. (B) Forest plots of the comparisons (panel A) bradycardia, (panel B) hypotension, and (panel C) all-cause mortality.

