Figure 3.

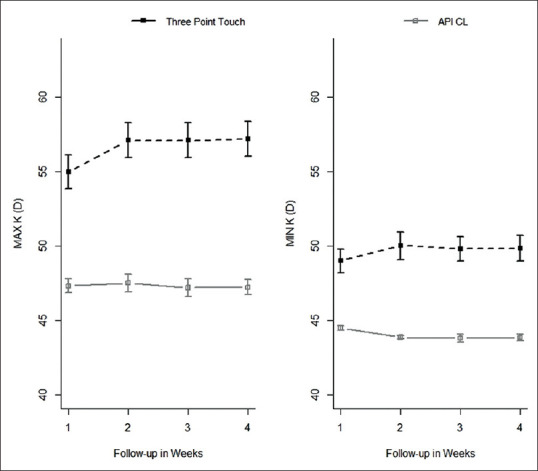
Shows the changes in the maximum and minimum simulated keratometry values in “Three-point touch” and “Apical clearance” groups across the visits

Shows the changes in the maximum and minimum simulated keratometry values in “Three-point touch” and “Apical clearance” groups across the visits