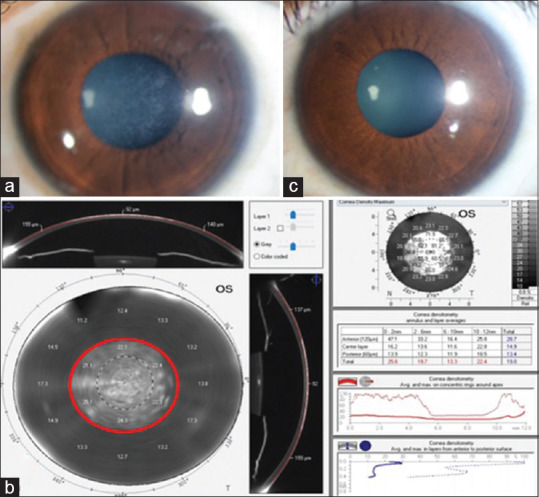
Figure 2.

Clinical images illustrating corneas which underwent PRK surgery using Slit lamp bio microscopy (a) Corneal haze subject: cornea of grade 2 subepithelial corneal haze 12 months post PRK. (b) To visualize post PRK haze, the densitometry mapping by Oculus Pentacam shows absolute values in different zones within normal range for control with increase in Gray scale units (GY) at 0–2, 2–6- and 6–10-mm zone in the anterior 120 micrometer in corneal haze subject is shown (c) Control subject: clear cornea 12 months post PRK.
