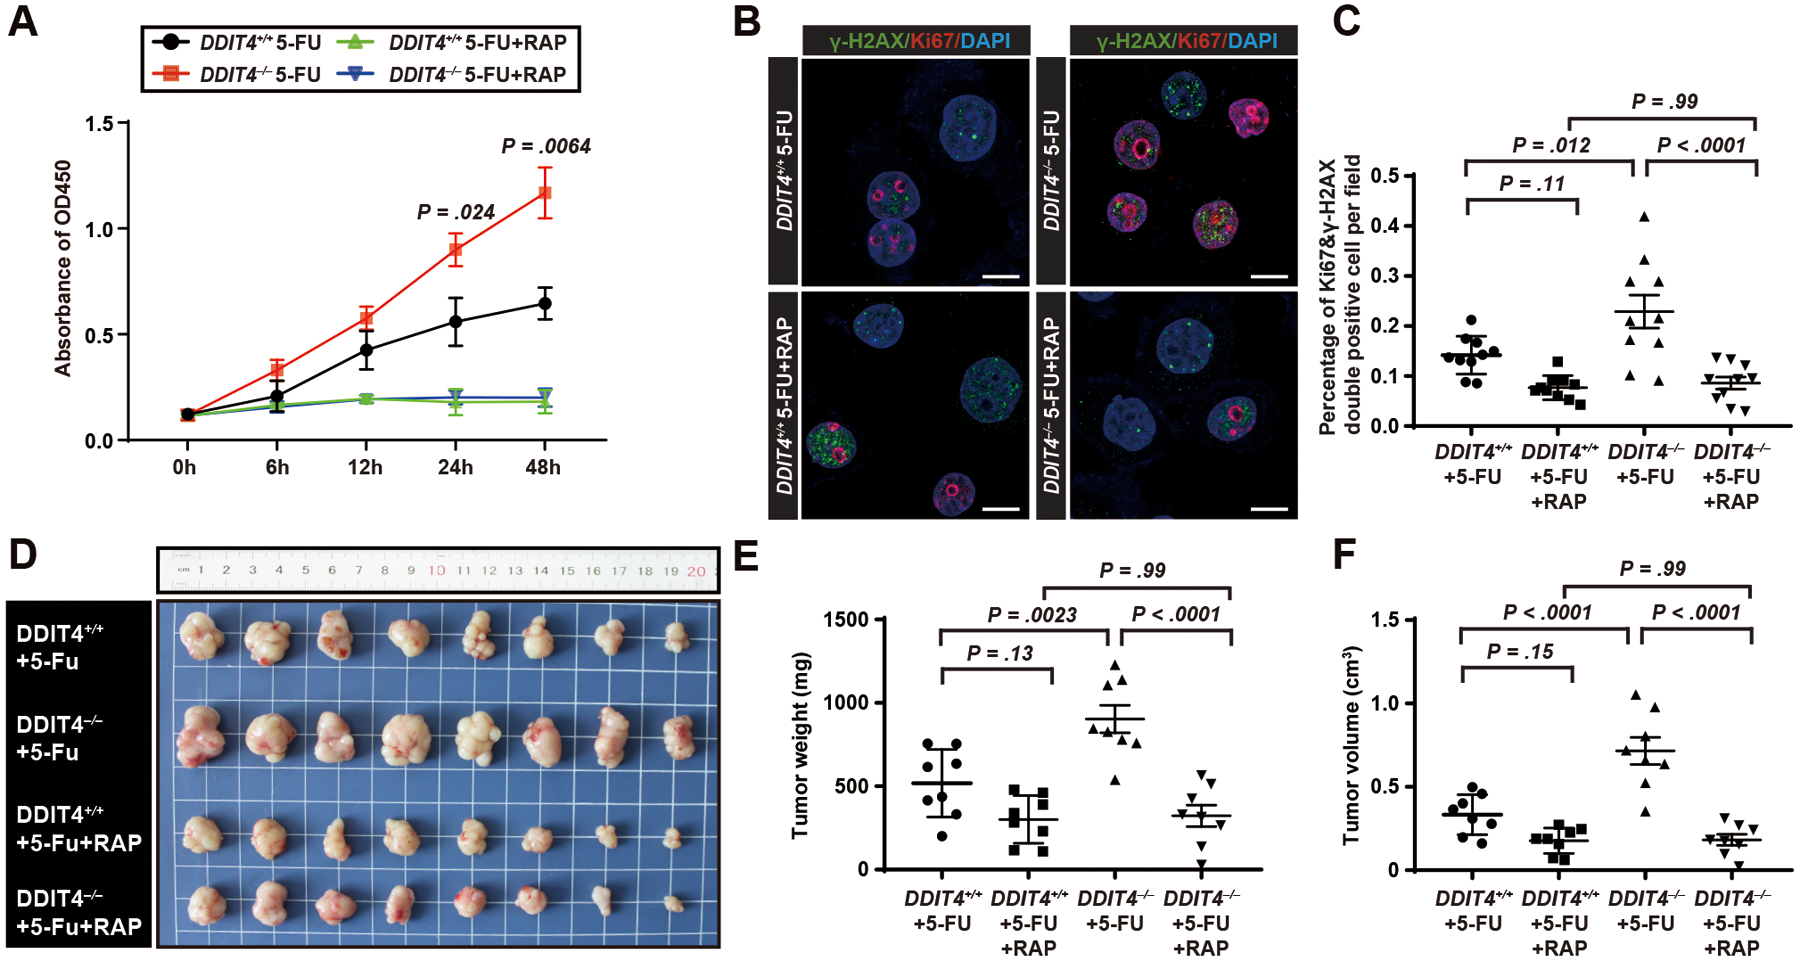
Figure 5. Rapamycin rescues the phenotype of human DDIT4−/− gastric cancer cells indicating effects of DDIT4 loss on proliferation are via mTORC1.

A. DDIT4−/− and DDIT4+/+ MGC-803 gastric cancer cell lines were treated with 5-FU or 5-FU with rapamycin, and proliferation measured by CCK-8 assay. Datapoint: mean ± SEM of 3 independent experiments with significance estimated by unpaired, two-tailed t test of the area under the curve (to avoid repeated measurement bias) of each individual experiment up until 24h and 48h.
B. Confocal immunofluorescence for Ki-67 (proliferation) and γ-H2AX (DNA damage) of MGC-803 cells treated with 5-FU or 5-FU with Rapamycin. Green, γ-H2AX; Red, Ki67; Blue, DAPI. Scale bar, 5μm.
C. Quantification of Ki67+γ-H2AX+ cells (ie proliferating cells with DNA damage) per field in (B). Data point: mean ± SD from 10 independent fields with significance estimated by one-way ANOVA with Tukey post hoc test.
D. DDIT4−/− and DDIT4+/+ cells were xenografted into the flanks of nude BALB/c mice which were then treated with 5-FU or 5-FU with Rapamycin (see Figure 4G for treatment scheme). n=8 for each group.
E. Tumor weight in (D) quantified. Each datapoint represents a single tumor with mean ± SD indicated and significance estimated by one-way ANOVA with Tukey post hoc test.
F. Quantification of (D) for tumor volume estimated from tumor length (L) and width (W) as: (L × W2) π/6. Statistics and plotting as for (E).
