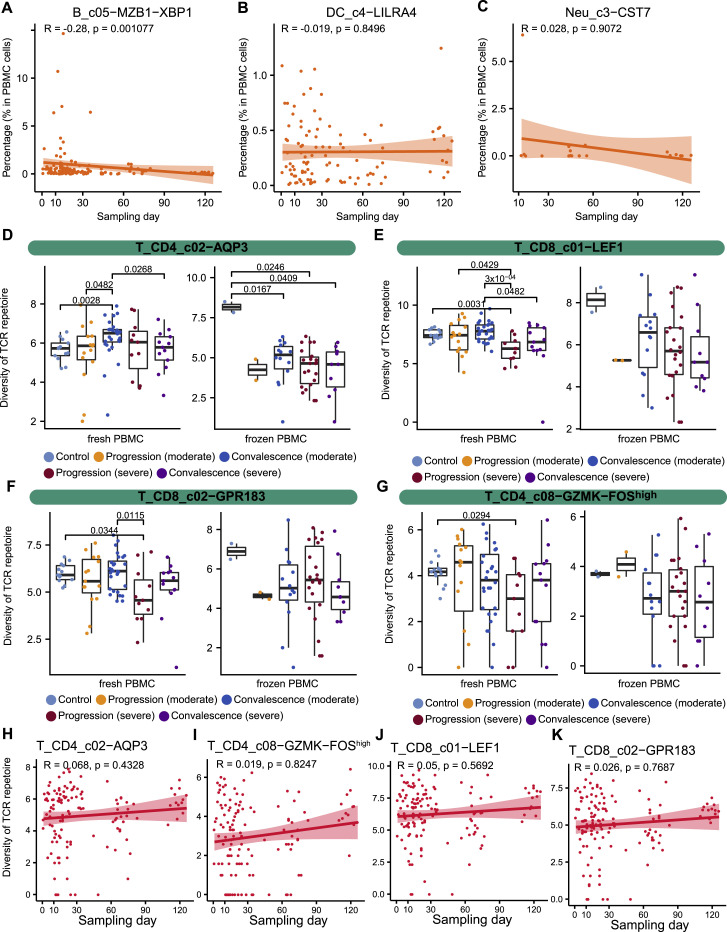
Figure S3.
Effects of sampling time and sample processing methods (fresh or frozen) on immune cell composition and the BCR/TCR diversity, related to Figures 2 and 3
(A) Gross relationship between B_c05−MZB1−XBP1 frequency in PBMC and sampling days. ANOVA rejected the association between B_c05−MZB1−XBP1 frequency and sampling days after incorporating age, sex, COVID-19 severity and stage (Figure 2A). (B) Gross relationship between DC_c4−LILRA4 frequency in PBMC and sampling days. (C) Gross relationship between Neu_c3−CST7 frequency in PBMC and sampling days. (D-G) Comparison among patient groups for T_CD4_c02−AQP3, T_CD8_c01−LEF1, T_CD8_c02−GPR183, and T_CD4_c08−GZMK−FOShigh via separating fresh and frozen PBMC samples. (H-K) Gross relationship of sampling time with frequencies of T_CD4_c02−AQP3, T_CD4_c08−GZMK−FOShigh, T_CD8_c01−LEF1, and T_CD8_c02−GPR183.

