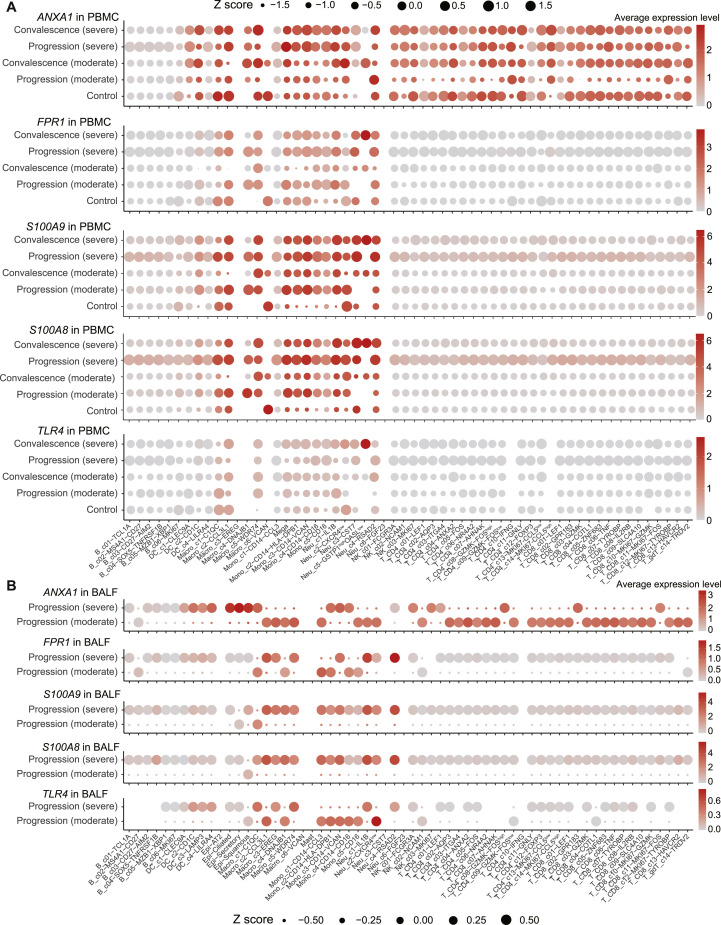
Figure S6.
The expression of selected genes in PBMC and BALF samples, related to Figure 5
(A) Dot plots showing the expression of S100A9 in cell clusters found in PBMCs. Each dot is colored by the mean expression and sized by the scaled mean (Z scores). The blue box highlights the expressions in patients belonging to the progression (severe) group. (B) Dot plots showing the expression of ANXA1 (top), FPR1 (middle) and TLR4 (bottom) in clusters found in PBMCs. (B) Dot plots showing the expression of ANXA1 (first panel), FPR1 (second panel), S100A9 (third panel), S100A8 (fourth panel) and TLR4 (bottom panel) in clusters found in BALFs. Each dot is colored by the means of the expression and sized by the scaled means (Z scores).

