Figure 4.

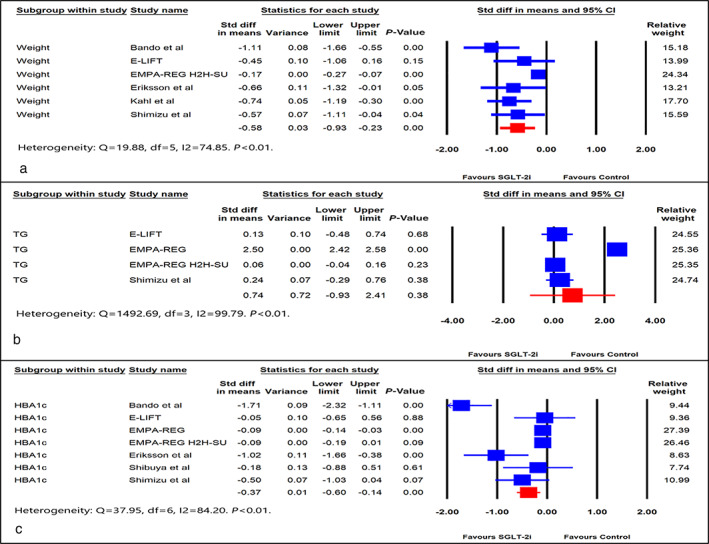
Forest plot comparing effect of SGLT‐2i versus control on: (a) weight, (b) triglyceride (TG), and (c) HBA1c. CI, confidence interval; Std, standard.

Forest plot comparing effect of SGLT‐2i versus control on: (a) weight, (b) triglyceride (TG), and (c) HBA1c. CI, confidence interval; Std, standard.