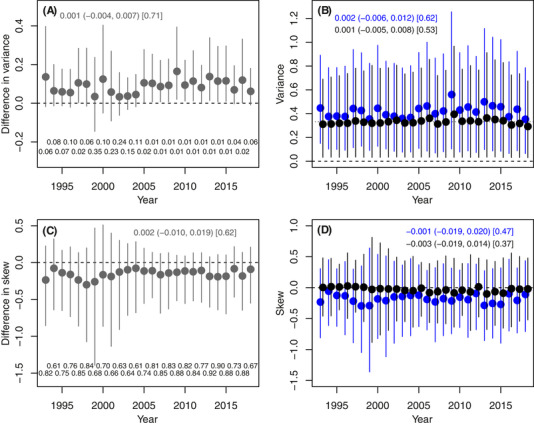
Figure 3.

Summaries of posterior distributions of (A) the difference in the variance in u i versus the variance in a i; (B) the variances in u i (blue) and a i (black); (C) the difference in the skew in u i versus the skew in a i; and (D) the skew in u i (blue) and in a i (black) across all individuals in each cohort during 1993–2018. Points show posterior means, with 95% credible intervals. Dashed black lines denote zero. In (B), the dotted black line denotes the direct base population estimate of VA, adjusted for mean coefficient of inbreeding during 1993–2018 (VA(1‐F), with F = 0.078). In (A) and (C), differences were calculated across pairwise posterior samples. Statistics shown above the plots are the posterior mean change across cohorts, with 95% credible interval (in parentheses) and posterior probability that the regression slope was positive (in square brackets). Statistics below the plots show the posterior probability that each cohort difference is negative.
