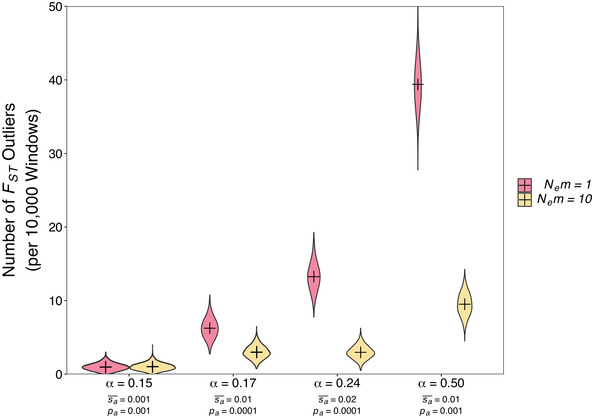
Figure 2.

The number FST outliers per 10,000 windows for parapatric populations subject to global adaptation. The text on the horizontal axis details the proportion of adaptive substitutions (α) observed in simulated populations as well as parameters of the distribution of fitness effect assumed. The mean effect of beneficial mutations is given by and the proportion of new mutations that were beneficial is given by pa. FST was calculated for 10,000 bp analysis windows centered on simulated “gene‐like regions” using the method of Weir and Cockerham (1984). Outliers were determined using the 99.99th percentile of the distribution of FST from neutral simulations. Plusses indicate the point estimate and violins indicate the distribution of 1000 bootstraps samples from 2000 simulated datasets. Populations were simulated with N = 5000 diploid individuals per deme.
