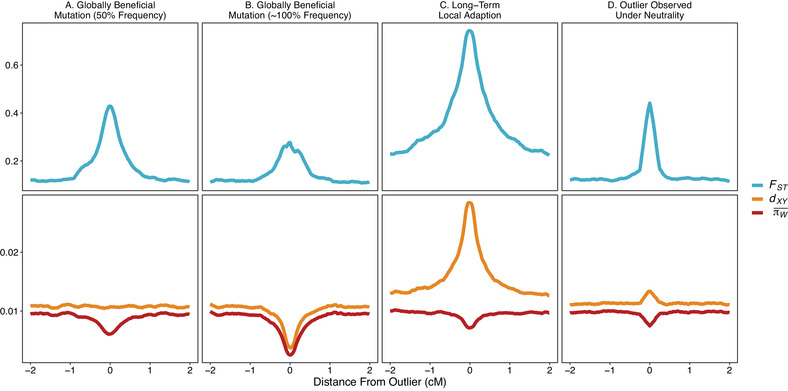
Figure 3.

Summaries of population genomic data in regions surrounding FST outliers generated by global adaptation, local adaptation, and genetic drift. Weir and Cockerham's FST and nucleotide diversity between (dXY) and within () populations are shown. We identified 100 FST outliers from simulations of each of the four processes shown in the plot. Summary statistics were calculated in 10,000 bp sliding windows with a 500 bp step. In the cases of global and local adaptation, alleles with sa = 0.05 were simulated. In all simulations shown Nm = 1.
