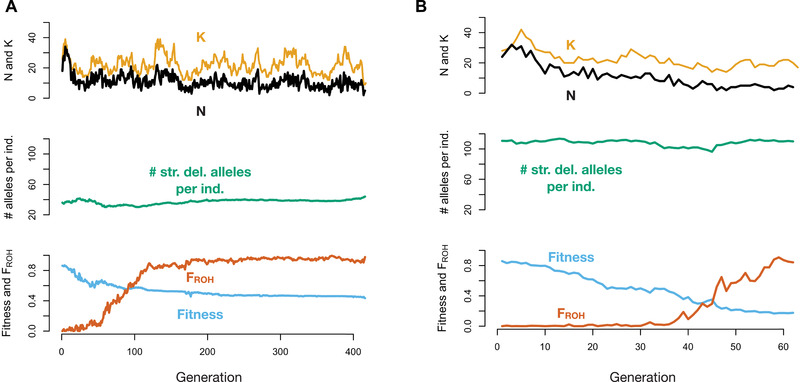
Figure 3.

Representative examples of population contraction simulations with ancestral populations of varying size. (A) Example with K ancestral = 1000. (B) Example with K ancestral = 15,000. The top of each panel shows population size (N) in black and carrying capacity (K) in gold, the middle shows the average number of strongly deleterious alleles (s < –0.01) per individual, and the bottom shows mean absolute fitness in blue and mean inbreeding coefficient (F ROH) in orange. For both replicates, K endangered = 25 and an hmix model of dominance was assumed. Note the differing x‐axis scales for panels A and B.
