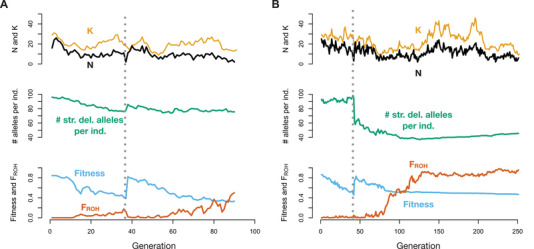
Figure 6.

Representative examples of genetic rescue simulations with source populations of varying size. (A) Example when a large source population (K = 10,000) is used for genetic rescue. (B) Example when a moderate‐sized (K = 1000) is used. The top of each panel shows population size (N) in black and carrying capacity (K) in gold, the middle shows the average number of strongly deleterious alleles (s < −0.01) per individual, and the bottom shows mean absolute fitness in blue and mean inbreeding coefficient (F ROH) in green. The dashed gray line indicates the generation in which migration occurred. For both replicates, K endangered = 25 and an hmix model of dominance was assumed. Note the differing x‐axis scales for panels A and B.
