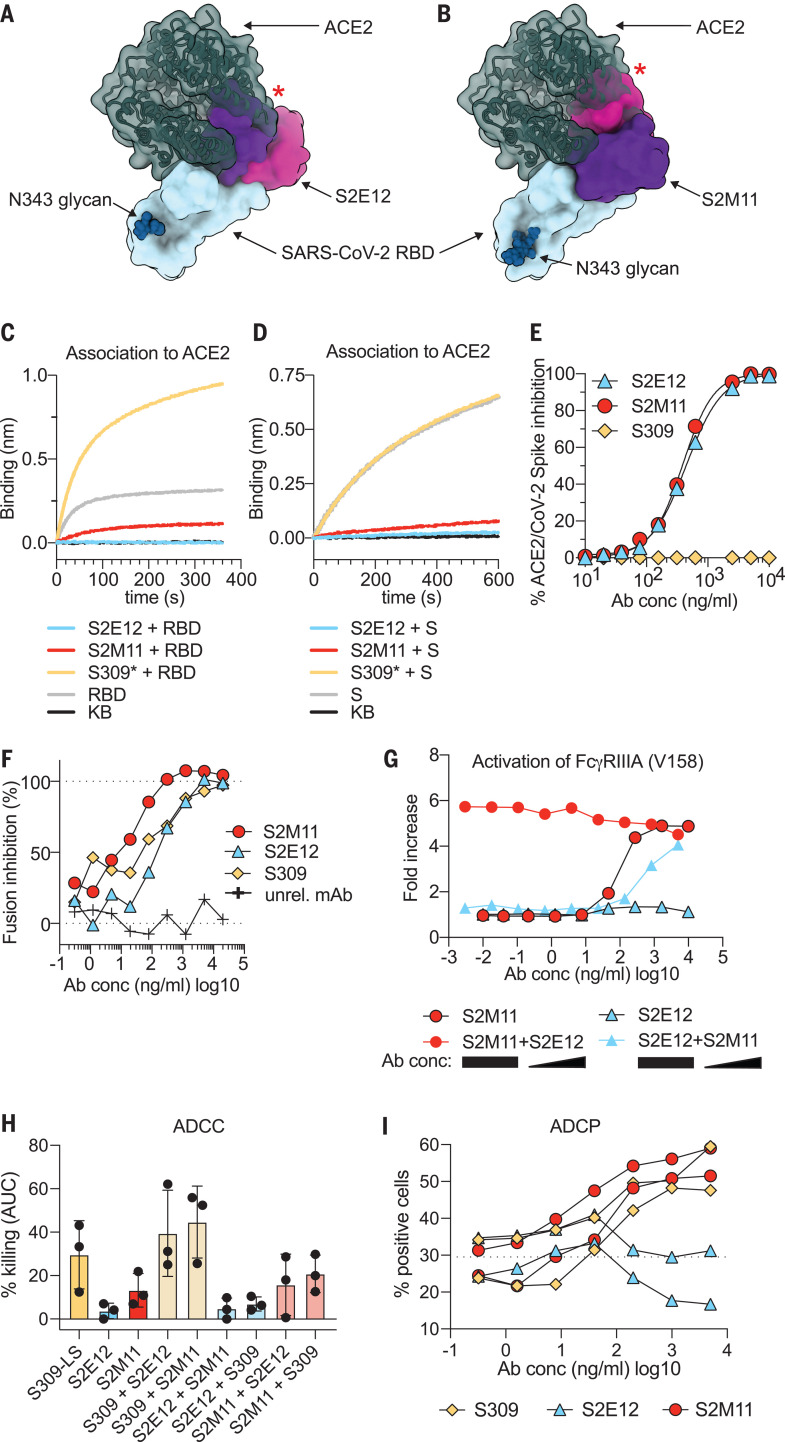
Fig. 4. S2E12 and S2M11 prevent SARS-CoV-2 S attachment to ACE2 and inhibit membrane fusion, and S2M11 triggers effector functions.
(A) S2E12 (magenta/purple) and ACE2 (dark green) bind overlapping binding sites on the SARS-CoV-2 RBD (blue). (B) S2M11 (magenta/purple) and ACE2 (dark green) bind overlapping binding sites on the SARS-CoV-2 RBD (blue). The red stars indicate steric clashes. (C and D) Binding of the SARS-CoV-2 RBD (C) or S ectodomain trimer (D) alone (gray) or precomplexed with the S2M11 (red), S2E12 (blue), or S309* (yellow) mAbs to the ACE2 ectodomain immobilized at the surface of biosensors analyzed by biolayer interferometry. S309* is an optimized version of the parent S309 mAb (21). KB, kinetic buffer (negative control). (E) Binding of varying concentrations of S2E12 (blue), S2M11 (red), or S309 (yellow) mAbs to full-length S expressed at the surface of CHO cells in the presence of the ACE2 ectodomain (20 μg/ml) analyzed by flow cytometry (one measurement per condition). (F) Cell-cell fusion inhibition assay with Vero E6 cells transfected with SARS-CoV-2 S and incubated with varying concentrations of S2E12 (blue), S2M11 (red), S309 (yellow), or a control mAb. The values are normalized to the percentage of fusion without mAb and to the percentage of fusion of nontransfected cells. (G) FcγRIIIa (high-affinity variant V158) signaling induced by individual mAbs or mAb cocktails. For mAb cocktails, the concentration of the constant mAb was 5 μg/ml. The concentration of the diluted mAb is indicated on the x axis. (H) ADCC using primary NK cells as effectors and SARS-CoV-2 S-expressing CHO cells as targets. The magnitude of NK cell–mediated killing is expressed as the area under the curve (AUC) for each mAb used at concentrations ranging between 0.1 ng/ml and 20 μg/ml. For mAb cocktails, the mAb listed first was kept constant at 5 μg/ml. Each symbol represents one donor; data are combined from two individual experiments. See fig. S6E for curves from a representative donor. (I) ADCP using peripheral blood mononuclear cells (PBMCs) as a source of phagocytic cells (monocytes) and PKH67–fluorescently labeled S-expressing CHO cells as target cells. The y axis indicates percentage of monocytes double-positive for anti-CD14 (monocyte) marker and PKH67. The dashed line indicates the signal detected in the presence of target and effector cells but without mAb (baseline). Each line indicates the data for one PBMC donor. Symbols are means of duplicates. Data are from one experiment. Ab conc, mAb concentration.

