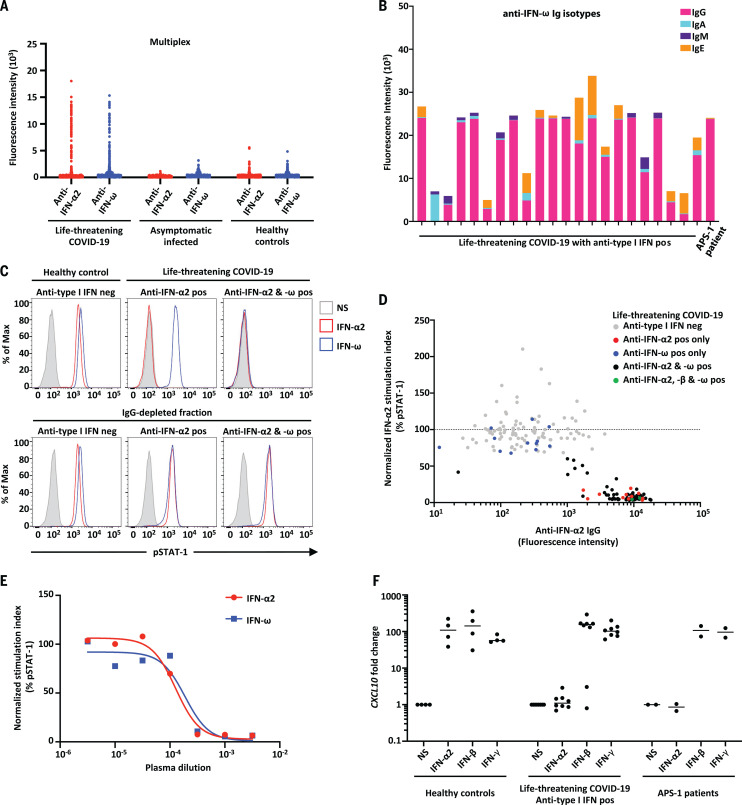
Fig. 1. Neutralizing auto-Abs against IFN-α2 and/or IFN-ω in patients with life-threatening COVID-19.
(A) Multiplex particle-based assay for auto-Abs against IFN-α2 and IFN-ω in patients with life-threatening COVID-19 (N = 782), in patients with asymptomatic or mild SARS-CoV-2 infection (N = 443), and in healthy controls not infected with SARS-CoV-2 (N = 1160). (B) Anti–IFN-ω Ig isotypes in 23 patients with life-threatening COVID-19 and auto-Abs to type I IFNs. (C) Representative fluorescence-activated cell sorting (FACS) plots depicting IFN-α2– or IFN-ω–induced pSTAT1 in healthy control cells (gated on CD14+ monocytes) in the presence of 10% healthy control or anti–IFN-α2 or anti–IFN-ω auto-Abs–containing patient plasma (top panel) or an IgG-depleted plasma fraction (bottom panel). Max, maximum; neg, negative; pos, positive; NS, not stimulated. (D) Plot of anti–IFN-α2 auto-Ab levels against their neutralization capacity. The stimulation index (stimulated over unstimulated condition) for the plasma from each patient was normalized against that of healthy control plasma from the same experiment. Spearman’s rank correlation coefficient = −0.6805; P < 0.0001. (E) Median inhibitory concentration (IC50) curves representing IFN-α2– and IFN-ω–induced pSTAT1 levels in healthy donor cells in the presence of serial dilutions of patient plasma. The stimulation index (stimulated over unstimulated condition) for patient plasma was normalized against that of 10% healthy control plasma. IFN-α2: IC50 = 0.016%, R2 = 0.985; IFN-ω: IC50 = 0.0353%, R2 = 0.926. R2, coefficient of determination. (F) Neutralizing effect on CXLC10 induction, after stimulation with IFN-α2, IFN-β, or IFN-γ, in the presence of plasma from healthy controls (N = 4), patients with life-threatening COVID-19 and auto-Abs against IFN-α2 (N = 8), and APS-1 patients (N = 2).

