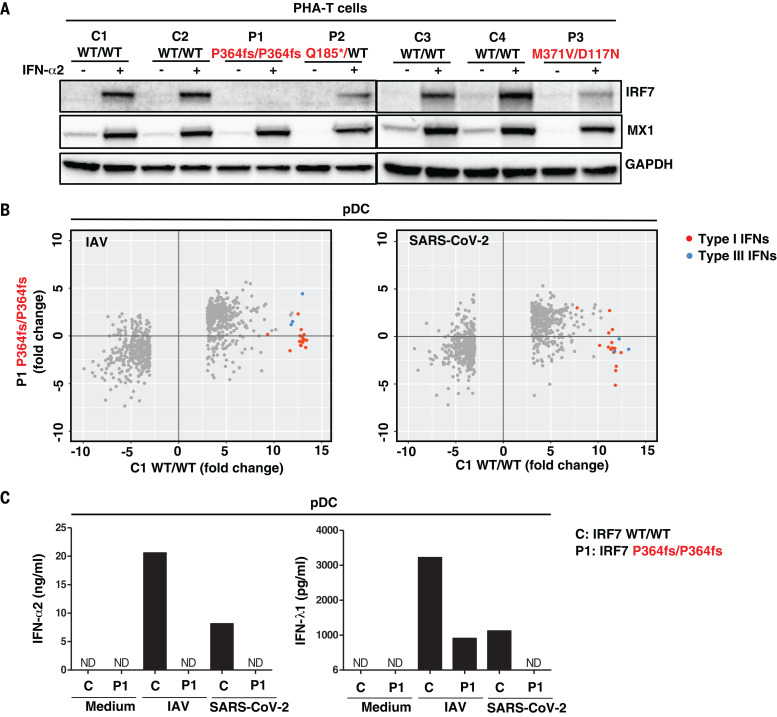
Fig. 4. Type I IFN responses in patient cells defective for IRF7.
(A) Levels of the IRF7 protein in PHA-T cells from two patients with AR IRF7 deficiency (P1 and P3), one patient with AD IRF7 deficiency (P2), and four healthy donors (C1 to C4). Cells were either left untreated or stimulated with IFN-α2 for 24 hours, and protein levels were measured by Western blotting. MX1 was used as a positive control for IFN-α2 treatment. (B) pDCs isolated from an AR IRF7-deficient patient (P1) and a healthy donor (C1) were either left untreated or infected with influenza A virus (IAV) or SARS-CoV-2, and RNA-seq was performed. Genes with expression >2.5-fold higher or lower in C1 after infection are plotted as the fold change in expression. Red dots are type I IFN genes; blue dots are type III IFN genes. (C) pDCs isolated from healthy donor C and IRF7-deficient patient (P1) were either left untreated (Medium) or infected with IAV or SARS-CoV-2, and the production of IFN-α2 and IFN-λ1 was measured by CBA and ELISA, respectively, on the supernatant. ND, not detected.

