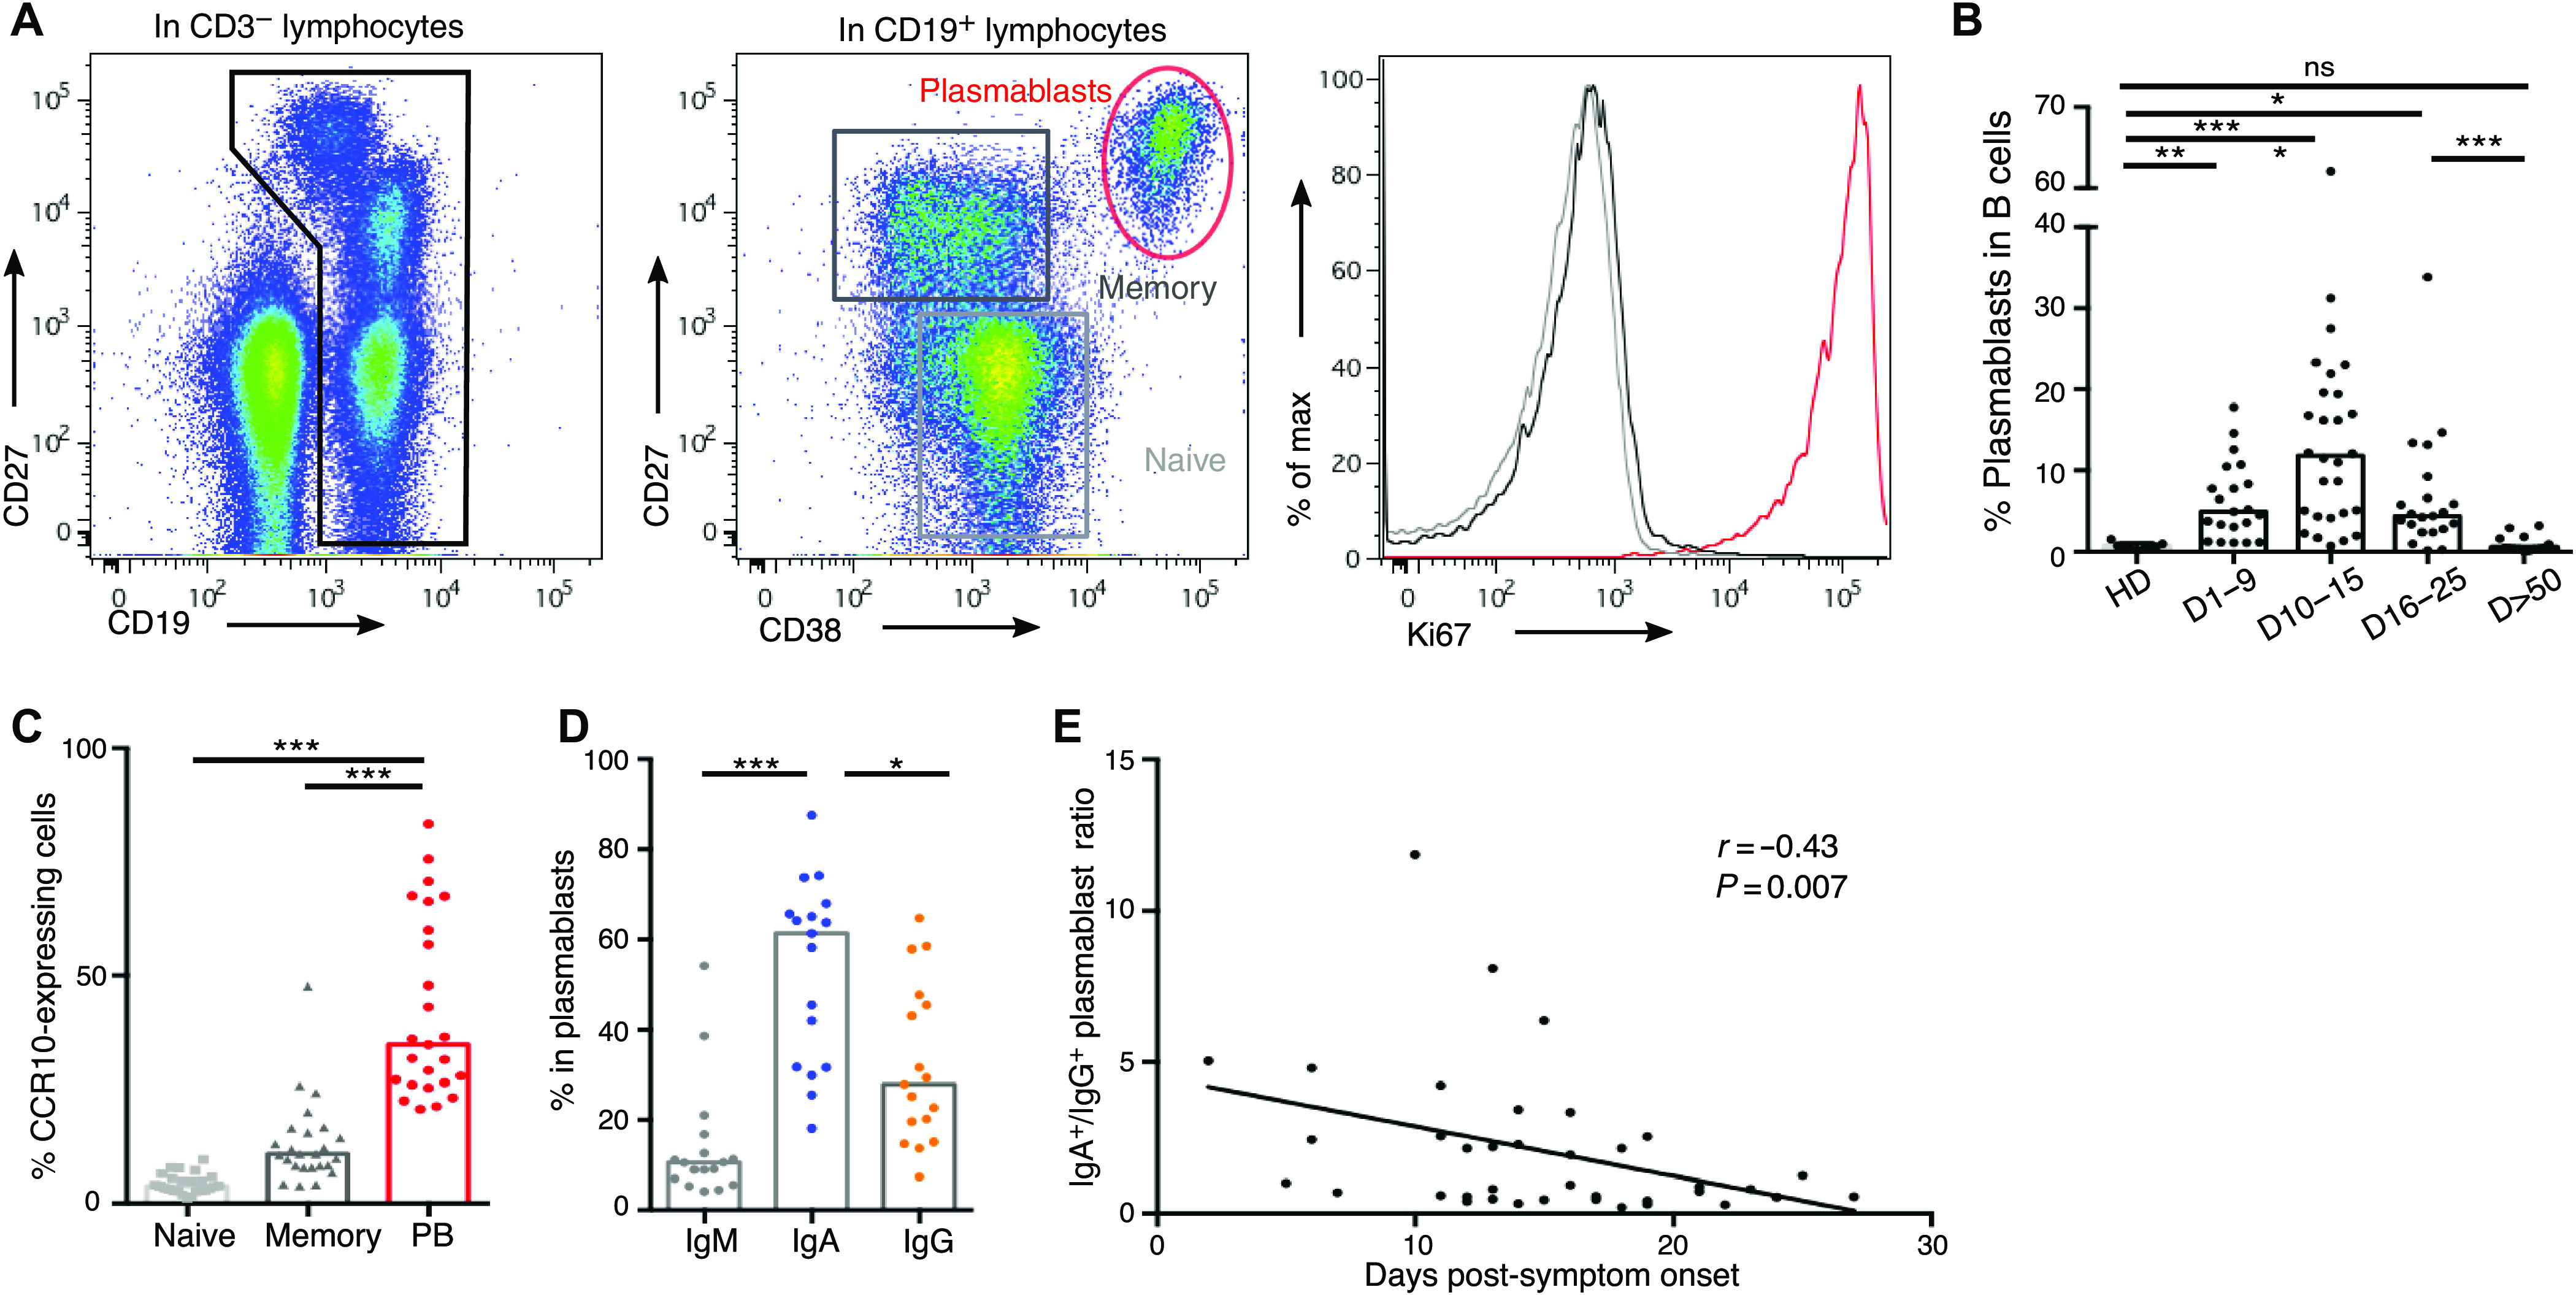
Fig. 1. Plasmablast dynamics after SARS-CoV-2 infection.

(A) Representative flow cytometry analysis of B cell subpopulations in the blood of SARS-CoV-2–infected patients. Doublets and dead cells were excluded before CD3−CD19+ gating. Plasmablasts are defined as Ki67+CD19lowCD27highCD38high cells, memory B cells as Ki67−CD19+CD27+IgD−, and naive B cells as Ki67−CD19+CD27−IgD+ cells. (B) Plasmablast frequency in B cell compartment in blood of SARS-CoV-2–infected patients (n = 38, clinical characteristics in table S1) compared with healthy donors (HD; n = 9). Histograms represent medians. P values were calculated using Dunn’s multiple comparison test (*P < 0.05, **P < 0.01, and ***P < 0.001). ns, not significant. (C) Flow cytometry analysis of CCR10 expression in B cell subpopulations in blood of SARS-CoV-2–infected patients (n = 25). Samples used in this analysis were collected from day 3 to day 27 after symptom onset. Histograms represent medians. P values were calculated using Wilcoxon test (***P < 0.001). (D) Intracellular antibody expression in circulating plasmablasts in blood of SARS-CoV-2–infected patients (n = 17) using flow cytometry. Samples used in this analysis were collected from days 2 to 23 after symptom onset. Histograms represent medians. P values were calculated using Dunn’s multiple comparison test (*P < 0.05 and ***P < 0.001). (E) Intracellular IgA versus IgG expression in plasmablasts according to disease duration. Each dot represents one patient. Nonparametric Spearman correlation was calculated.
