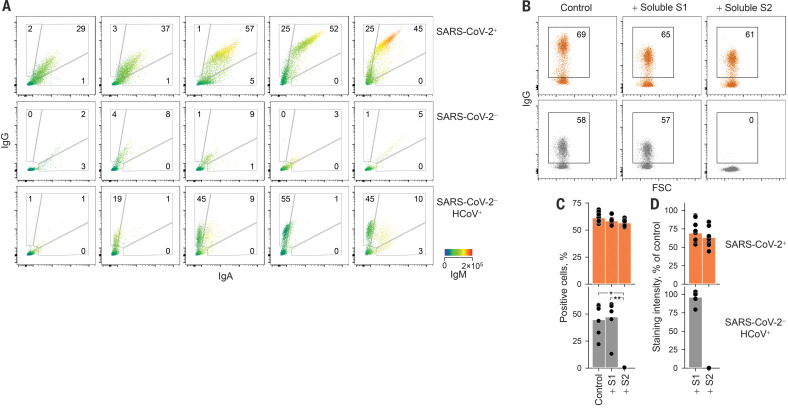
Fig. 1. Flow cytometric detection and specificity of antibodies reactive with SARS-CoV-2 S.
(A) Detection of IgG, IgA, and IgM in five individuals from each indicated group. IgM levels are indicated by a heatmap. (B to D) Inhibition of SARS-CoV-2 S binding of sera from SARS-CoV-2–infected (SARS-CoV-2+, n = 10) or SARS-CoV-2–uninfected (SARS-CoV-2− HCoV+, n = 6) patients by soluble S1 or S2. (B) Flow cytometry profile of one representative patient per group. (C) Mean frequency of positive cells. *P = 0.015; **P = 0.006, one-way analysis of variance (ANOVA) on ranks. (D) Mean staining intensity [mean fluorescence intensity (MFI) of sample as a percentage of negative control MFI]. In (C) and (D), dots represent individual samples from one of three similar experiments.

