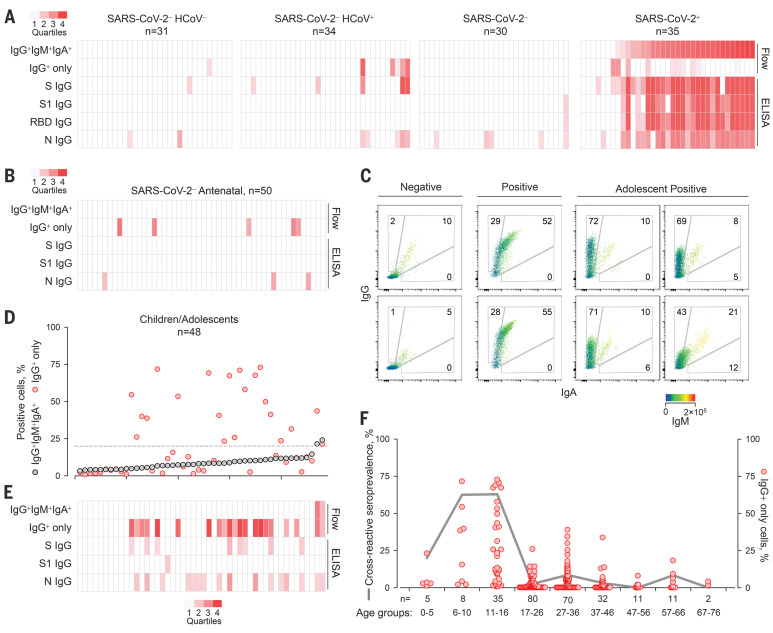
Fig. 2. Prevalence of SARS-CoV-2 S–cross-reactive antibodies detected by different methods.
(A) Flow cytometry and ELISA results for each sample in cohorts A and C to E listed in table S1. (B) Flow cytometry and ELISA results for serum samples from SARS-CoV-2–uninfected pregnant women. (C to E) SARS-CoV-2 S–cross-reactive antibodies in healthy children and adolescents. (C) Representative flow cytometry profiles of seronegative donors (Negative) or COVID-19 patients (Positive) and of SARS-CoV-2–uninfected adolescents with SARS-CoV-2 cross-reactive antibodies. (D) Frequency of cells stained with all three antibody classes (IgG+IgM+IgA+) or only with IgG (IgG+) ranked by their IgG+IgM+IgA+ frequency. The dashed line denotes the assay sensitivity cutoff. (E) Flow cytometry and ELISA results for each sample. (F) Prevalence of SARS-CoV-2 S–cross-reactive antibodies in the indicated age groups (line) and frequency of cells that stained only with IgG (dots) in all samples for which the date of birth was known. The heatmaps in (A), (B), and (E) represent the quartile values above each assay’s technical cutoff.

